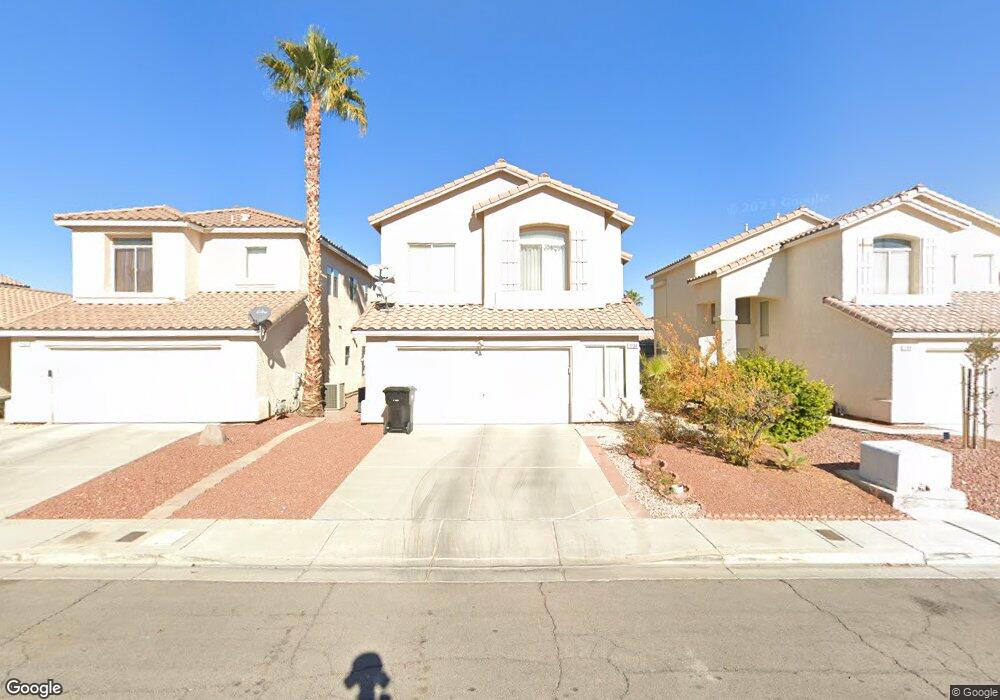
1138 Little Rock Way Unit 3 Las Vegas, NV 89123
Silverado Ranch NeighborhoodEstimated Value: $493,509 - $559,000
6
Beds
3
Baths
2,390
Sq Ft
$223/Sq Ft
Est. Value
About This Home
This home is located at 1138 Little Rock Way Unit 3, Las Vegas, NV 89123 and is currently estimated at $532,877, approximately $222 per square foot. 1138 Little Rock Way Unit 3 is a home located in Clark County with nearby schools including John R Beatty Elementary School, Jack Lund Schofield Middle School, and Silverado High School.
Ownership History
Date
Name
Owned For
Owner Type
Purchase Details
Closed on
Apr 11, 2005
Sold by
Qureshi Faiza A
Bought by
Qureshi Munir A and Qureshi Najma P
Current Estimated Value
Purchase Details
Closed on
Mar 2, 2004
Sold by
Thomas John and Thomas Shyni
Bought by
Qureshi Faiza A
Home Financials for this Owner
Home Financials are based on the most recent Mortgage that was taken out on this home.
Original Mortgage
$302,100
Interest Rate
4.25%
Purchase Details
Closed on
Mar 27, 1997
Sold by
Bilt Perma
Bought by
Thomas John and Thomas Shyni
Home Financials for this Owner
Home Financials are based on the most recent Mortgage that was taken out on this home.
Original Mortgage
$147,400
Interest Rate
7.63%
Create a Home Valuation Report for This Property
The Home Valuation Report is an in-depth analysis detailing your home's value as well as a comparison with similar homes in the area
Home Values in the Area
Average Home Value in this Area
Purchase History
| Date | Buyer | Sale Price | Title Company |
|---|---|---|---|
| Qureshi Munir A | -- | -- | |
| Qureshi Faiza A | $318,000 | Old Republic Title Co Of Ne | |
| Thomas John | $155,500 | Nevada Title Company |
Source: Public Records
Mortgage History
| Date | Status | Borrower | Loan Amount |
|---|---|---|---|
| Previous Owner | Qureshi Faiza A | $302,100 | |
| Previous Owner | Thomas John | $147,400 |
Source: Public Records
Tax History Compared to Growth
Tax History
| Year | Tax Paid | Tax Assessment Tax Assessment Total Assessment is a certain percentage of the fair market value that is determined by local assessors to be the total taxable value of land and additions on the property. | Land | Improvement |
|---|---|---|---|---|
| 2025 | $2,087 | $112,186 | $35,700 | $76,486 |
| 2024 | $2,026 | $112,186 | $35,700 | $76,486 |
| 2023 | $1,551 | $104,558 | $31,850 | $72,708 |
| 2022 | $2,157 | $97,231 | $30,450 | $66,781 |
| 2021 | $1,997 | $86,823 | $23,450 | $63,373 |
| 2020 | $1,852 | $84,994 | $22,050 | $62,944 |
| 2019 | $1,735 | $82,690 | $20,300 | $62,390 |
| 2018 | $1,656 | $76,109 | $16,450 | $59,659 |
| 2017 | $2,257 | $76,956 | $16,450 | $60,506 |
| 2016 | $1,551 | $73,209 | $12,250 | $60,959 |
| 2015 | $1,547 | $60,480 | $10,500 | $49,980 |
| 2014 | $1,502 | $49,822 | $7,000 | $42,822 |
Source: Public Records
Map
Nearby Homes
- 1058 Silver Stone Way Unit 3
- 1058 Warm Canyon Way
- 0 S Maryland Pkwy
- 971 Whispering Grove Ave
- 960 Clear Diamond Ave
- 927 Clear Diamond Ave
- 920 Clear Diamond Ave
- 1006 Coldwater Falls Way
- 8343 Rockefeller St
- 896 Clear Diamond Ave
- 8379 Drop Camp St
- 8378 Green Cedar Dr
- 8777 Shady Peak Way Unit 2
- 899 Hornbeak Ct
- 861 Clear Diamond Ave
- 8272 Beaverbrook Way
- 1123 Aldenwood Ave
- 1115 Aldenwood Ave
- 8698 Waterford Bend St
- 8880 Star Valley Ct
- 1132 Little Rock Way
- 1144 Little Rock Way
- 1126 Little Rock Way
- 1150 Little Rock Way
- 8564 Red Diamond St
- 8563 Stone Mill Way
- 1120 Little Rock Way
- 8558 Red Diamond St
- 8557 Stone Mill Way
- 1135 Little Rock Way
- 1141 Little Rock Way
- 1129 Little Rock Way
- 1129 Little Rock Way
- 1129 Little Rock Way
- 1114 Little Rock Way Unit 3
- 8552 Red Diamond St
- 1147 Little Rock Way
- 1123 Little Rock Way
- 1153 Little Rock Way
- 1168 Little Rock Way Unit 3