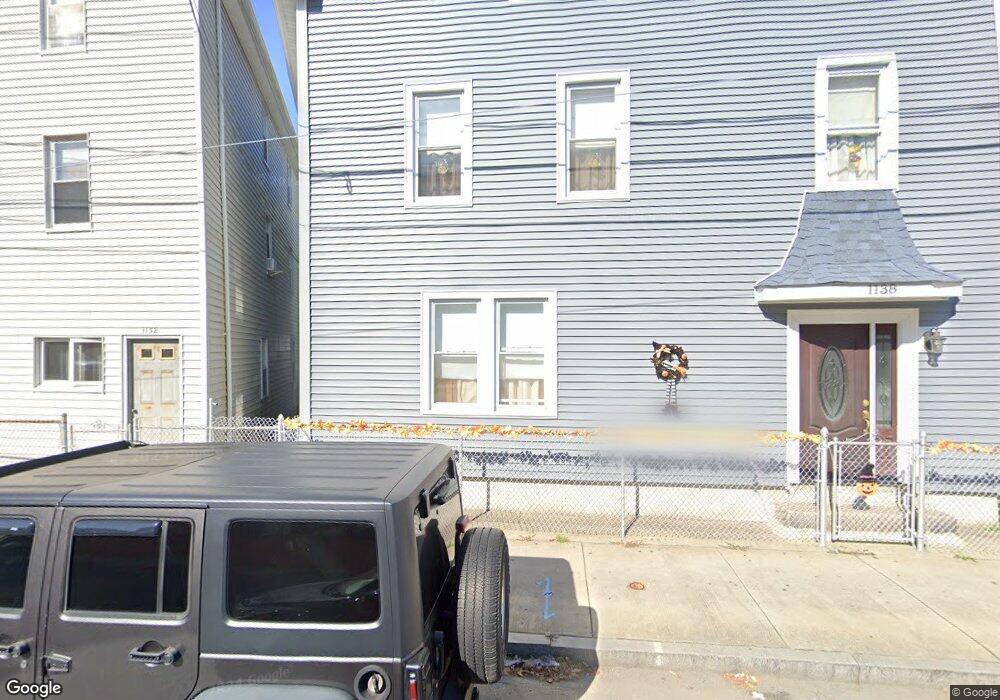
1138 N Main St Fall River, MA 02720
Western Fall River NeighborhoodEstimated Value: $578,364 - $709,000
8
Beds
3
Baths
3,635
Sq Ft
$180/Sq Ft
Est. Value
About This Home
This home is located at 1138 N Main St, Fall River, MA 02720 and is currently estimated at $654,091, approximately $179 per square foot. 1138 N Main St is a home located in Bristol County with nearby schools including Spencer Borden Elementary School, Morton Middle School, and B M C Durfee High School.
Ownership History
Date
Name
Owned For
Owner Type
Purchase Details
Closed on
Nov 30, 2022
Sold by
Correia Carol A
Bought by
Correia Carol A and Correia Anthony M
Current Estimated Value
Purchase Details
Closed on
Oct 12, 1989
Sold by
Pimentel Jose M
Bought by
Correia Carol A
Purchase Details
Closed on
Dec 21, 1988
Sold by
Pimentel Jose M
Bought by
Pimental Jose M
Create a Home Valuation Report for This Property
The Home Valuation Report is an in-depth analysis detailing your home's value as well as a comparison with similar homes in the area
Home Values in the Area
Average Home Value in this Area
Purchase History
| Date | Buyer | Sale Price | Title Company |
|---|---|---|---|
| Correia Carol A | -- | None Available | |
| Correia Carol A | $137,000 | -- | |
| Pimental Jose M | $75,000 | -- |
Source: Public Records
Mortgage History
| Date | Status | Borrower | Loan Amount |
|---|---|---|---|
| Previous Owner | Pimental Jose M | $132,000 | |
| Previous Owner | Pimental Jose M | $90,000 | |
| Previous Owner | Pimental Jose M | $94,000 | |
| Previous Owner | Pimental Jose M | $20,013 |
Source: Public Records
Tax History
| Year | Tax Paid | Tax Assessment Tax Assessment Total Assessment is a certain percentage of the fair market value that is determined by local assessors to be the total taxable value of land and additions on the property. | Land | Improvement |
|---|---|---|---|---|
| 2025 | $5,551 | $484,800 | $106,000 | $378,800 |
| 2024 | $5,310 | $462,100 | $102,100 | $360,000 |
| 2023 | $4,683 | $381,700 | $84,400 | $297,300 |
| 2022 | $3,637 | $304,500 | $80,300 | $224,200 |
| 2021 | $3,637 | $263,000 | $76,400 | $186,600 |
| 2020 | $3,280 | $227,000 | $75,300 | $151,700 |
| 2019 | $2,807 | $192,500 | $72,500 | $120,000 |
| 2018 | $2,814 | $192,500 | $78,600 | $113,900 |
| 2017 | $2,643 | $188,800 | $74,900 | $113,900 |
| 2016 | $2,598 | $190,600 | $79,700 | $110,900 |
| 2015 | $2,493 | $190,600 | $79,700 | $110,900 |
| 2014 | $2,506 | $199,200 | $77,300 | $121,900 |
Source: Public Records
Map
Nearby Homes
- 327 Brownell St
- 33-35 Malvey St
- 10 N Court St Unit 3
- 302 Cory St
- 11 Dyer St
- 909 High St Unit 1
- 889 High St
- 376 N Underwood St
- 267 Lincoln Ave
- 102 Vestal St
- 213 Weetamoe St
- 750 Davol St Unit 219
- 750 Davol St Unit 221
- 750 Davol St Unit 616
- 750 Davol St Unit 214
- 131 Stewart St Unit 2
- 131 Stewart St Unit 3A
- 36 Saint Mary St
- 160 Stewart St
- 503 Highland Ave
- 1150 N Main St
- 1150 N Main St Unit 3
- 1150 N Main St Unit 1
- 1128 N Main St
- 1120 N Main St
- 1120 N Main St Unit 2
- 1116 N Main St Unit 2
- 317 Brownell St
- 1166 N Main St
- 1110 N Main St
- 332 Brownell St
- 1114 N Main St
- 322 Brownell St Unit 3W
- 322 Brownell St Unit 1 West
- 322 Brownell St Unit 3 West
- 322 Brownell St Unit 3 East
- 322 Brownell St Unit 2 West
- 322 Brownell St Unit 2 East
- 1170 N Main St Unit 40
- 295 Brownell St
Your Personal Tour Guide
Ask me questions while you tour the home.