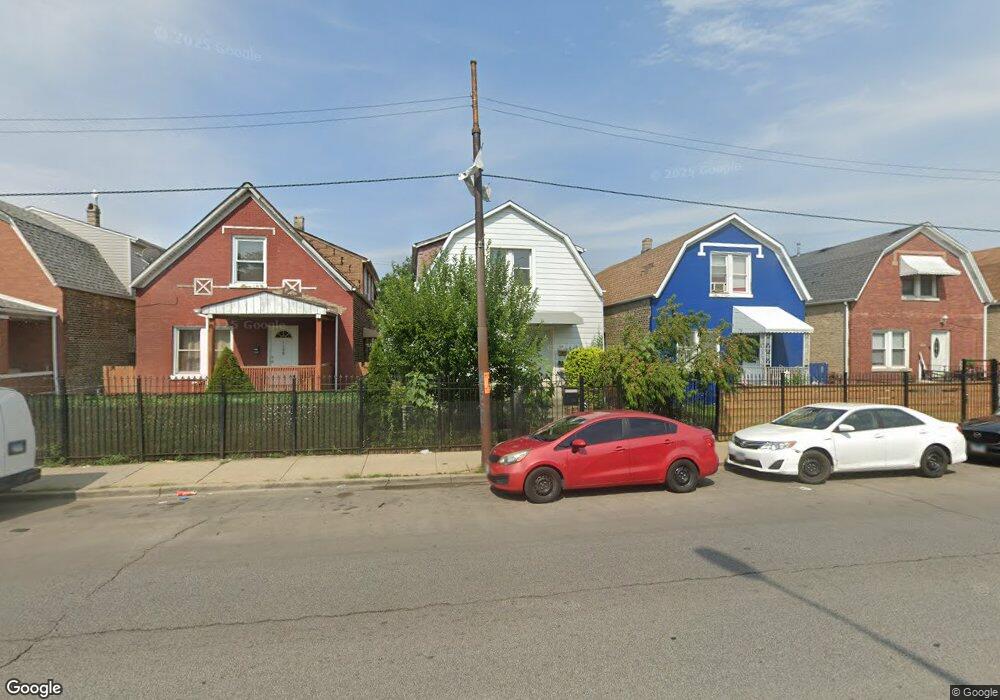
1138 N Pulaski Rd Chicago, IL 60651
West Humboldt Park NeighborhoodEstimated Value: $326,943 - $383,000
4
Beds
3
Baths
2,125
Sq Ft
$166/Sq Ft
Est. Value
About This Home
This home is located at 1138 N Pulaski Rd, Chicago, IL 60651 and is currently estimated at $353,236, approximately $166 per square foot. 1138 N Pulaski Rd is a home located in Cook County with nearby schools including Brian Piccolo Elementary School, Orr Academy High School, and KIPP One Academy.
Ownership History
Date
Name
Owned For
Owner Type
Purchase Details
Closed on
Dec 3, 2003
Sold by
Payes Carlos A and Ramirez Luis A
Bought by
Guerra Jose M and Lara Corina L
Current Estimated Value
Purchase Details
Closed on
Feb 4, 2002
Sold by
Payes Carlos A and Ramirez Luis A
Bought by
Guerra Jose M and Lara Corina L
Home Financials for this Owner
Home Financials are based on the most recent Mortgage that was taken out on this home.
Original Mortgage
$118,000
Interest Rate
7.14%
Mortgage Type
Commercial
Purchase Details
Closed on
Dec 18, 2001
Sold by
Payes Carlos A and Ramierz Luis A
Bought by
Payes Carlos A and Ramirez Luis A
Home Financials for this Owner
Home Financials are based on the most recent Mortgage that was taken out on this home.
Original Mortgage
$118,000
Interest Rate
7.14%
Mortgage Type
Commercial
Purchase Details
Closed on
Aug 22, 2000
Sold by
Rios Librada
Bought by
Payes Carlos A and Ramirez Luis A
Home Financials for this Owner
Home Financials are based on the most recent Mortgage that was taken out on this home.
Original Mortgage
$107,590
Interest Rate
8.15%
Mortgage Type
FHA
Create a Home Valuation Report for This Property
The Home Valuation Report is an in-depth analysis detailing your home's value as well as a comparison with similar homes in the area
Home Values in the Area
Average Home Value in this Area
Purchase History
| Date | Buyer | Sale Price | Title Company |
|---|---|---|---|
| Guerra Jose M | -- | -- | |
| Guerra Jose M | -- | Lawyers Title Insurance Corp | |
| Payes Carlos A | -- | -- | |
| Payes Carlos A | $108,500 | Chicago Title Insurance Co |
Source: Public Records
Mortgage History
| Date | Status | Borrower | Loan Amount |
|---|---|---|---|
| Closed | Guerra Jose M | $118,000 | |
| Closed | Payes Carlos A | $107,590 |
Source: Public Records
Tax History
| Year | Tax Paid | Tax Assessment Tax Assessment Total Assessment is a certain percentage of the fair market value that is determined by local assessors to be the total taxable value of land and additions on the property. | Land | Improvement |
|---|---|---|---|---|
| 2025 | $2,942 | $31,000 | $5,670 | $25,330 |
| 2024 | $2,942 | $31,000 | $5,670 | $25,330 |
| 2023 | $3,513 | $24,536 | $4,536 | $20,000 |
| 2022 | $3,513 | $20,500 | $4,536 | $15,964 |
| 2021 | $4,156 | $24,000 | $4,536 | $19,464 |
| 2020 | $2,503 | $14,336 | $5,292 | $9,044 |
| 2019 | $2,660 | $16,670 | $5,292 | $11,378 |
| 2018 | $2,614 | $16,670 | $5,292 | $11,378 |
| 2017 | $4,167 | $22,734 | $4,725 | $18,009 |
| 2016 | $4,053 | $22,734 | $4,725 | $18,009 |
| 2015 | $3,685 | $22,734 | $4,725 | $18,009 |
| 2014 | $2,962 | $18,531 | $4,536 | $13,995 |
| 2013 | $2,892 | $18,531 | $4,536 | $13,995 |
Source: Public Records
Map
Nearby Homes
- 4027 W Crystal St Unit 2
- 4016 W Crystal St
- 4044 W Crystal St
- 1015 N Pulaski Rd
- 1018 N Harding Ave
- 1032 N Springfield Ave
- 1130 N Hamlin Ave
- 942 N Harding Ave
- 4138 W Potomac Ave
- 1029 N Avers Ave
- 924 N Pulaski Rd
- 1011 N Keeler Ave
- 1028 N Hamlin Ave
- 919 N Karlov Ave
- 1001 N Hamlin Ave
- 1328 N Avers Ave
- 4247 W Haddon Ave
- 4250 W Haddon Ave
- 1336 N Hamlin Ave
- 913 N Kedvale Ave
- 1142 N Pulaski Rd
- 1136 N Pulaski Rd
- 1136 N Pulaski Rd
- 1144 N Pulaski Rd
- 1134 N Pulaski Rd
- 1148 N Pulaski Rd
- 1130 N Pulaski Rd
- 1150 N Pulaski Rd
- 1126 N Pulaski Rd Unit 2
- 1126 N Pulaski Rd
- 1139 N Keystone Ave
- 1143 N Keystone Ave
- 1137 N Keystone Ave
- 1152 N Pulaski Rd
- 1133 N Keystone Ave
- 1145 N Keystone Ave
- 1124 N Pulaski Rd Unit 1
- 1149 N Keystone Ave
- 1131 N Keystone Ave
- 1131 N Keystone Ave
Your Personal Tour Guide
Ask me questions while you tour the home.