
Seller's Agent in 2025
Kimberly Carpenter
Trueblood Real Estate
(317) 509-4000
1 in this area
288 Total Sales
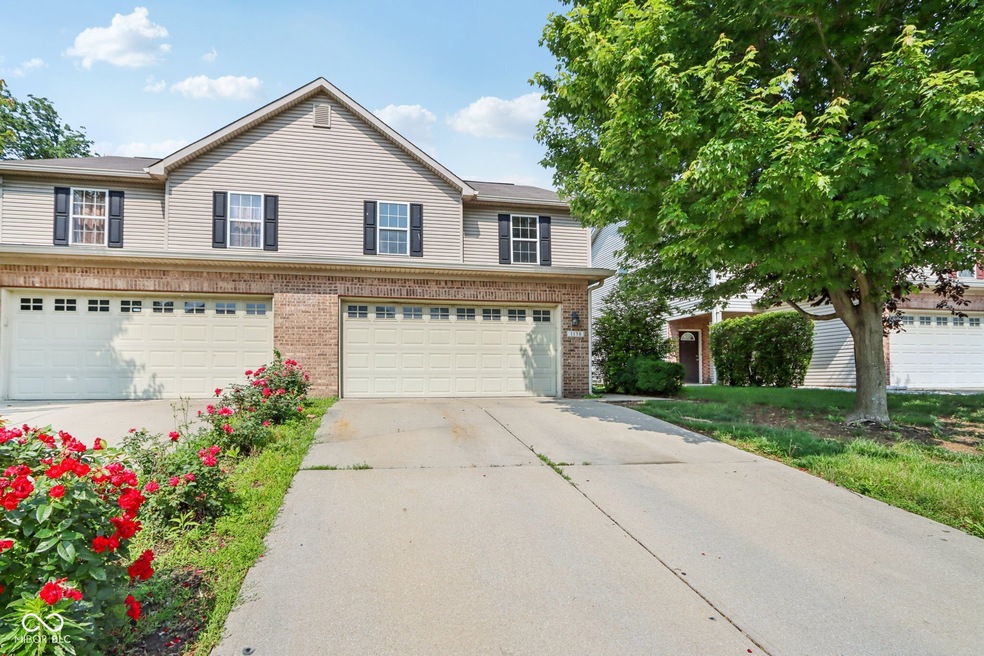
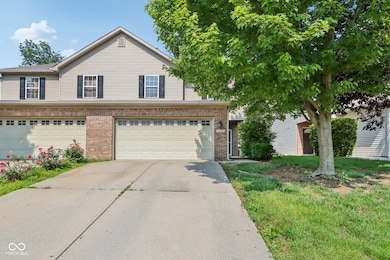
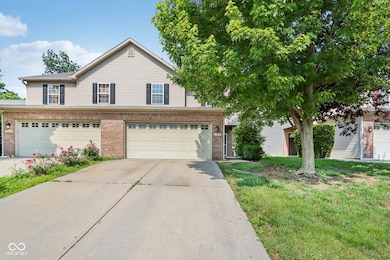
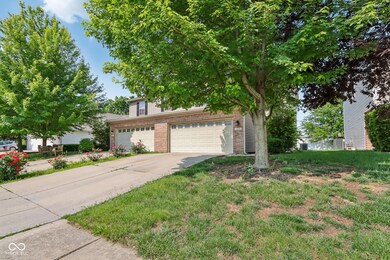
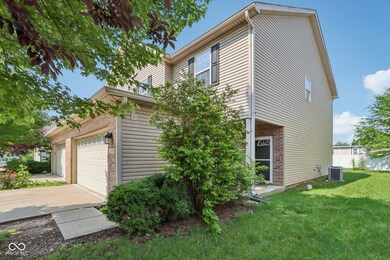
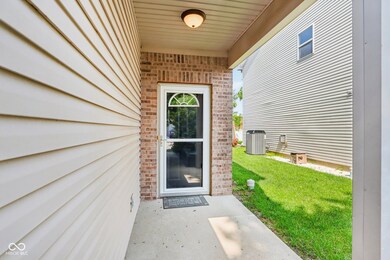
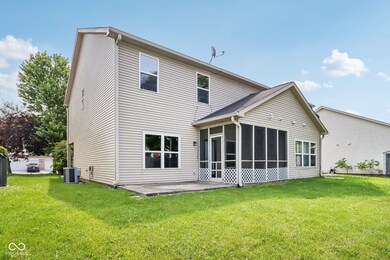
Nestled at 1138 Topp Creek DR, INDIANAPOLIS, IN, this townhouse offers a compelling invitation to experience comfortable living. With 1740 square feet of living area spread across two stories, this residence provides ample space for relaxation and daily activities, enhanced by three bedrooms that offer private retreats for rest and rejuvenation. Imagine the possibilities within these thoughtfully designed walls, where each room presents a canvas for your personal touch. The screened porch, patio and lot area extends your living space outdoors, offering opportunities for recreation, or simply enjoying the fresh air in your own private setting. Built in 2006, this townhouse combines contemporary design with enduring appeal.
Last Agent to Sell the Property
Trueblood Real Estate License #RB14039231 Listed on: 06/13/2025
Last Buyer's Agent
Perla Palma
Carpenter, REALTORS®
| Date | Type | Sale Price | Title Company |
|---|---|---|---|
| Warranty Deed | -- | Enterprise Title | |
| Interfamily Deed Transfer | -- | None Available | |
| Warranty Deed | -- | None Available |
| Date | Status | Loan Amount | Loan Type |
|---|---|---|---|
| Open | $11,500 | Seller Take Back | |
| Open | $225,834 | FHA | |
| Previous Owner | $27,980 | Stand Alone Second | |
| Previous Owner | $111,920 | New Conventional |
| Date | Event | Price | List to Sale | Price per Sq Ft |
|---|---|---|---|---|
| 08/06/2025 08/06/25 | Sold | $230,000 | -2.1% | $132 / Sq Ft |
| 07/01/2025 07/01/25 | Pending | -- | -- | -- |
| 06/13/2025 06/13/25 | For Sale | $235,000 | 0.0% | $135 / Sq Ft |
| 04/17/2024 04/17/24 | Rented | $1,695 | 0.0% | -- |
| 04/17/2024 04/17/24 | For Rent | $1,695 | +11.1% | -- |
| 05/04/2023 05/04/23 | Rented | $1,525 | 0.0% | -- |
| 05/04/2023 05/04/23 | For Rent | $1,525 | +11.3% | -- |
| 05/05/2022 05/05/22 | Rented | $1,370 | 0.0% | -- |
| 05/05/2022 05/05/22 | For Rent | $1,370 | +4.6% | -- |
| 04/07/2021 04/07/21 | Rented | -- | -- | -- |
| 04/07/2021 04/07/21 | For Rent | $1,310 | +5.2% | -- |
| 03/17/2020 03/17/20 | Rented | -- | -- | -- |
| 03/17/2020 03/17/20 | For Rent | $1,245 | +3.8% | -- |
| 03/08/2019 03/08/19 | Rented | $1,200 | 0.0% | -- |
| 03/08/2019 03/08/19 | For Rent | $1,200 | +2.1% | -- |
| 03/21/2018 03/21/18 | Rented | $1,175 | 0.0% | -- |
| 03/21/2018 03/21/18 | For Rent | $1,175 | +6.8% | -- |
| 05/23/2017 05/23/17 | Rented | $1,100 | 0.0% | -- |
| 05/22/2017 05/22/17 | Under Contract | -- | -- | -- |
| 05/19/2017 05/19/17 | For Rent | $1,100 | -- | -- |
| Year | Tax Paid | Tax Assessment Tax Assessment Total Assessment is a certain percentage of the fair market value that is determined by local assessors to be the total taxable value of land and additions on the property. | Land | Improvement |
|---|---|---|---|---|
| 2024 | $3,869 | $159,300 | $24,700 | $134,600 |
| 2023 | $3,869 | $160,900 | $24,700 | $136,200 |
| 2022 | $3,424 | $141,200 | $24,700 | $116,500 |
| 2021 | $3,122 | $113,300 | $24,700 | $88,600 |
| 2020 | $3,148 | $114,300 | $24,700 | $89,600 |
| 2019 | $3,084 | $112,000 | $24,700 | $87,300 |
| 2018 | $2,484 | $102,800 | $24,700 | $78,100 |
| 2017 | $2,492 | $103,200 | $24,700 | $78,500 |
| 2016 | $2,457 | $101,800 | $24,700 | $77,100 |
| 2014 | $2,440 | $122,000 | $24,700 | $97,300 |
| 2013 | $1,323 | $122,000 | $24,700 | $97,300 |
Seller's Agent in 2025
Kimberly Carpenter
Trueblood Real Estate
(317) 509-4000
1 in this area
288 Total Sales
P
Buyer's Agent in 2025
Perla Palma
Carpenter, REALTORS®
D
Seller's Agent in 2024
Daniel Baldini
Polaris Real Estate Group, INC
(317) 749-2766
13 Total Sales
Source: MIBOR Broker Listing Cooperative®
MLS Number: 22044862
APN: 49-05-35-117-009.000-982
Disclaimer: Certain information contained herein is derived from information provided by parties other than Homes.com. All information provided is deemed reliable, but is not guaranteed to be accurate and should be independently verified.
![]() Based on information submitted to the MLS GRID. All data is obtained from various sources and may not have been verified by broker or MLS GRID. Supplied Open House Information is subject to change without notice. All information should be independently reviewed and verified for accuracy. Properties may or may not be listed by the office/agent presenting the information. Some IDX listings have been excluded from this website.
Based on information submitted to the MLS GRID. All data is obtained from various sources and may not have been verified by broker or MLS GRID. Supplied Open House Information is subject to change without notice. All information should be independently reviewed and verified for accuracy. Properties may or may not be listed by the office/agent presenting the information. Some IDX listings have been excluded from this website.