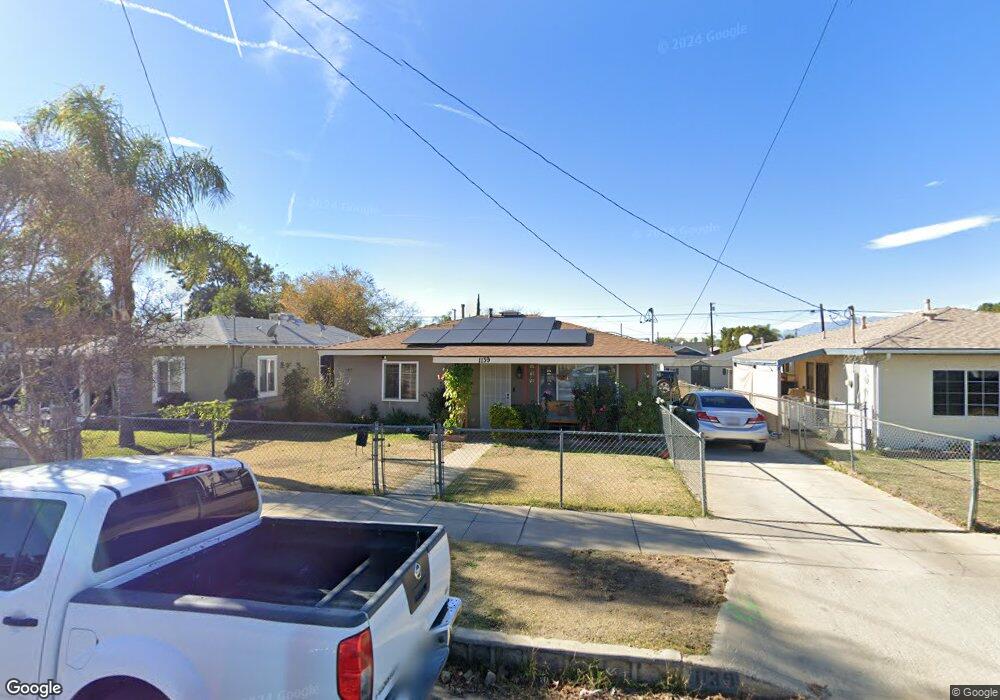
1139 Clay St Redlands, CA 92374
North Redlands NeighborhoodEstimated Value: $409,563 - $456,000
2
Beds
1
Bath
825
Sq Ft
$520/Sq Ft
Est. Value
About This Home
This home is located at 1139 Clay St, Redlands, CA 92374 and is currently estimated at $428,641, approximately $519 per square foot. 1139 Clay St is a home located in San Bernardino County with nearby schools including Kingsbury Elementary School, Moore Middle School, and Citrus Valley High School.
Ownership History
Date
Name
Owned For
Owner Type
Purchase Details
Closed on
Jan 13, 2003
Sold by
Villalta Maria M
Bought by
Benitez Jose V and Benitez Vilma D
Current Estimated Value
Home Financials for this Owner
Home Financials are based on the most recent Mortgage that was taken out on this home.
Original Mortgage
$75,123
Outstanding Balance
$32,352
Interest Rate
6.15%
Estimated Equity
$396,289
Purchase Details
Closed on
Feb 26, 1996
Sold by
Hud
Bought by
Benitez Jose V and Benitez Vilma D
Home Financials for this Owner
Home Financials are based on the most recent Mortgage that was taken out on this home.
Original Mortgage
$59,867
Interest Rate
7.34%
Mortgage Type
FHA
Purchase Details
Closed on
Mar 14, 1995
Sold by
Fleet Real Estate Funding Corp
Bought by
Hud
Purchase Details
Closed on
Dec 20, 1994
Sold by
Wandsberg Edwin
Bought by
Fleet Real Estate Funding Corp
Purchase Details
Closed on
Aug 16, 1994
Sold by
Jackson Martin George
Bought by
Jackson Martin George and Jackson Roland J
Create a Home Valuation Report for This Property
The Home Valuation Report is an in-depth analysis detailing your home's value as well as a comparison with similar homes in the area
Home Values in the Area
Average Home Value in this Area
Purchase History
| Date | Buyer | Sale Price | Title Company |
|---|---|---|---|
| Benitez Jose V | -- | Placer Title Company | |
| Benitez Jose V | $61,500 | First American Title Ins Co | |
| Hud | -- | Fidelity National Title Ins | |
| Fleet Real Estate Funding Corp | $86,680 | Fidelity National Title Ins | |
| Jackson Martin George | -- | -- |
Source: Public Records
Mortgage History
| Date | Status | Borrower | Loan Amount |
|---|---|---|---|
| Open | Benitez Jose V | $75,123 | |
| Previous Owner | Benitez Jose V | $59,867 |
Source: Public Records
Tax History Compared to Growth
Tax History
| Year | Tax Paid | Tax Assessment Tax Assessment Total Assessment is a certain percentage of the fair market value that is determined by local assessors to be the total taxable value of land and additions on the property. | Land | Improvement |
|---|---|---|---|---|
| 2025 | $1,439 | $128,088 | $37,167 | $90,921 |
| 2024 | $1,439 | $125,576 | $36,438 | $89,138 |
| 2023 | $1,435 | $123,114 | $35,724 | $87,390 |
| 2022 | $1,413 | $120,700 | $35,024 | $85,676 |
| 2021 | $1,437 | $118,333 | $34,337 | $83,996 |
| 2020 | $1,415 | $117,120 | $33,985 | $83,135 |
| 2019 | $1,375 | $114,824 | $33,319 | $81,505 |
| 2018 | $1,340 | $112,573 | $32,666 | $79,907 |
| 2017 | $1,327 | $110,365 | $32,025 | $78,340 |
| 2016 | $1,311 | $108,201 | $31,397 | $76,804 |
| 2015 | $1,300 | $106,575 | $30,925 | $75,650 |
| 2014 | $1,275 | $104,487 | $30,319 | $74,168 |
Source: Public Records
Map
Nearby Homes
- 1025 Clay St
- 1231 Webster St
- 1324 Clay St
- 1024 Lawton St
- 1218 6th St
- 834 Calhoun St
- 932 6th St
- 1312 Calhoun St
- 1007 Lawton St
- 2167 Bergamot St
- 843 Carlotta Ct
- 527 Ruiz St
- 1117 Oxford Dr
- 804 Tribune St
- 610 E Lugonia Ave Unit 4
- 700 E Lugonia Ave
- 1119 Church St
- 1510 Karon St
- 1636 Webster St
- 1602 Glover St