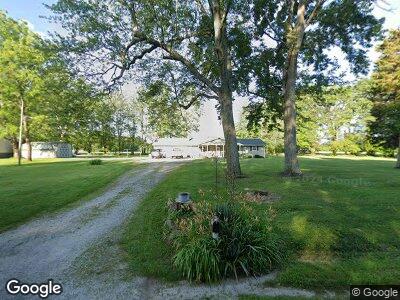
1139 Duncanson Rd Sardinia, OH 45171
Estimated Value: $256,498 - $344,000
3
Beds
2
Baths
2,200
Sq Ft
$137/Sq Ft
Est. Value
About This Home
This home is located at 1139 Duncanson Rd, Sardinia, OH 45171 and is currently estimated at $301,375, approximately $136 per square foot. 1139 Duncanson Rd is a home located in Highland County with nearby schools including Lynchburg-Clay Elementary School, Lynchburg-Clay Middle School, and Lynchburg-Clay High School.
Ownership History
Date
Name
Owned For
Owner Type
Purchase Details
Closed on
Oct 22, 2024
Sold by
David L Cremer And Tracy L Cremer Trust and Cremer David L
Bought by
Cremer David L and Cremer Tracy L
Current Estimated Value
Purchase Details
Closed on
Jul 16, 2021
Sold by
Cremer David L and Cremer Tracy L
Bought by
Cremer David L and Cremer Tracy L
Purchase Details
Closed on
Feb 26, 2004
Sold by
Cremer Tracy L and Cremer David L
Bought by
Cremer David L and Cremer Tracy L
Home Financials for this Owner
Home Financials are based on the most recent Mortgage that was taken out on this home.
Original Mortgage
$108,500
Interest Rate
4.99%
Mortgage Type
Stand Alone Refi Refinance Of Original Loan
Purchase Details
Closed on
Jan 1, 1990
Bought by
Richards Tracy Lynn
Create a Home Valuation Report for This Property
The Home Valuation Report is an in-depth analysis detailing your home's value as well as a comparison with similar homes in the area
Home Values in the Area
Average Home Value in this Area
Purchase History
| Date | Buyer | Sale Price | Title Company |
|---|---|---|---|
| Cremer David L | -- | None Listed On Document | |
| Cremer Irrevocable Heritage Trust | -- | None Listed On Document | |
| Cremer David L | -- | None Available | |
| Cremer David L | -- | -- | |
| Richards Tracy Lynn | -- | -- |
Source: Public Records
Mortgage History
| Date | Status | Borrower | Loan Amount |
|---|---|---|---|
| Previous Owner | Cremer David L | $70,000 | |
| Previous Owner | Cremer David L | $110,000 | |
| Previous Owner | Cremer David L | $112,000 | |
| Previous Owner | Cremer David L | $112,000 | |
| Previous Owner | Cremer David L | $35,260 | |
| Previous Owner | Cremer David L | $30,000 | |
| Previous Owner | Cremer David L | $108,500 |
Source: Public Records
Tax History Compared to Growth
Tax History
| Year | Tax Paid | Tax Assessment Tax Assessment Total Assessment is a certain percentage of the fair market value that is determined by local assessors to be the total taxable value of land and additions on the property. | Land | Improvement |
|---|---|---|---|---|
| 2024 | $2,178 | $75,150 | $9,030 | $66,120 |
| 2023 | $2,178 | $57,020 | $7,460 | $49,560 |
| 2022 | $1,779 | $57,020 | $7,460 | $49,560 |
| 2021 | $1,779 | $57,020 | $7,460 | $49,560 |
| 2020 | $1,471 | $45,610 | $5,950 | $39,660 |
| 2019 | $1,484 | $45,610 | $5,950 | $39,660 |
| 2018 | $1,491 | $45,610 | $5,950 | $39,660 |
| 2017 | $1,249 | $40,540 | $7,320 | $33,220 |
| 2016 | $1,260 | $40,540 | $7,320 | $33,220 |
| 2015 | $1,275 | $40,540 | $7,320 | $33,220 |
| 2014 | $1,318 | $40,540 | $7,320 | $33,220 |
| 2013 | $1,321 | $40,540 | $7,320 | $33,220 |
Source: Public Records
Map
Nearby Homes
- 1254 Gath Rd
- 0 N St Rt 32 Unit 1745639
- 725 Oak Leaf Rd
- 1084 E Dehaas Ln
- Ac Bachman Rd
- 500 Frye Rd
- 1514 Sitting Bull Dr
- 497 Spearhead Dr
- 7451 Brookfield Place
- 175 Winchester St
- 2226 Gath Rd
- 7464 Brookfield Place
- 111 Dewey Dr
- 0 Mochican Cove Unit 1833148
- 0 Arnheim Ashridge Rd Unit 1821389
- 0 Creek - Lot# 2795 Dr Unit 1803735
- 325 Ellis Rd
- 13196 Corrina Way
- 2011 Moccasin Dr
- 0 Lindsey Rd Unit 1819033
- 1139 Duncanson Rd
- 1139 Duncanson Rd
- 1139 Duncanson Rd
- 0 Duncanson Rd Unit 1107102
- 0 Duncanson Rd Unit 1144987
- 0 Duncanson Rd Unit 1178637
- 0 Duncanson Rd Unit 1201297
- 0 Duncanson Rd Unit 1396213
- 0 Duncanson Rd Unit 1805997
- 975 Duncanson Rd
- 1300 Gath South Rd
- 1299 Gath South Rd
- 1285 Gath Rd
- 1285 Gath Rd
- 1290 Gath Rd
- 955 Duncanson Rd
- 1275 Gath South Rd
- 1254 Gath South Rd
- 1254 Gath Rd
- 904 Duncanson Rd