1139 Hwy 583 N Tylertown, MS 39667
Estimated payment $2,979/month
About This Home
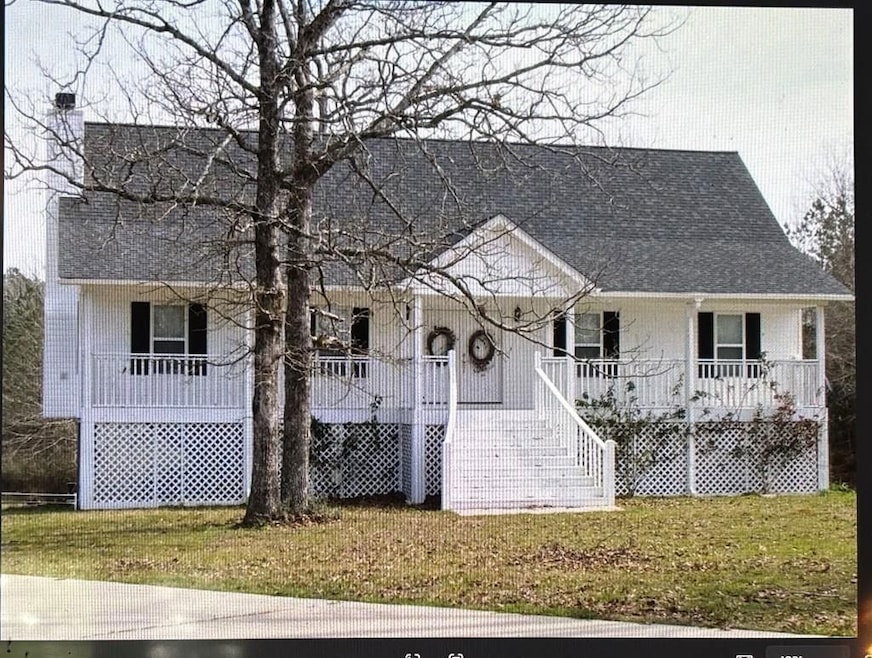
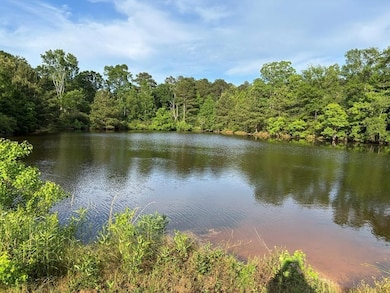
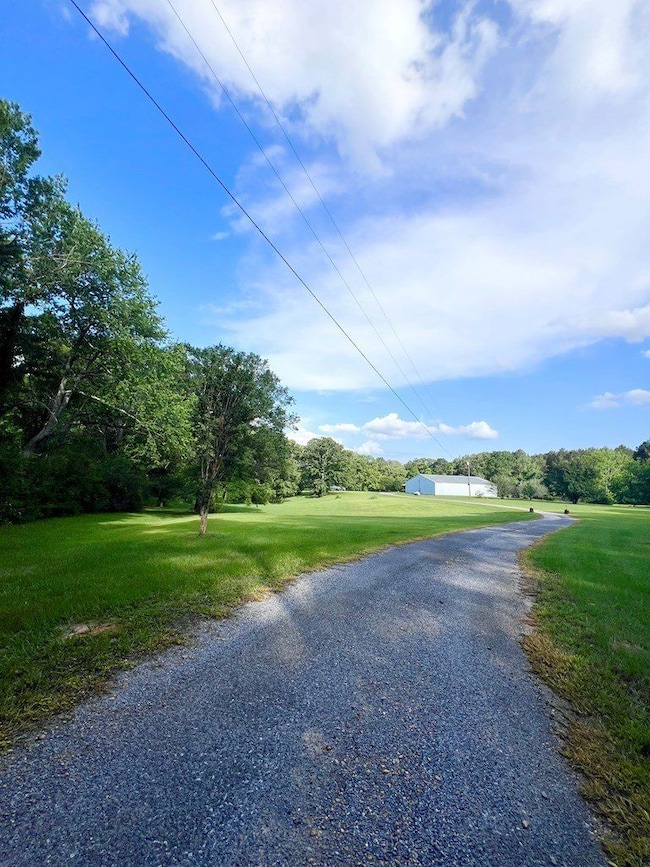
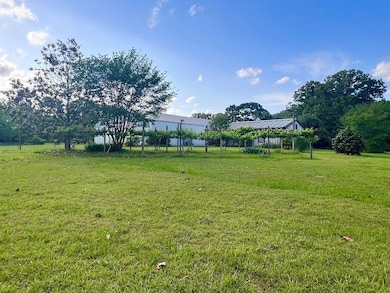
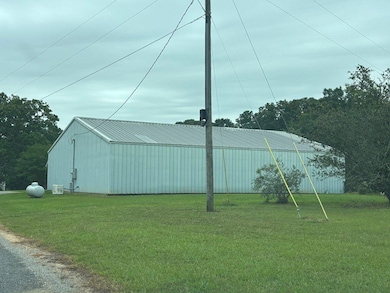
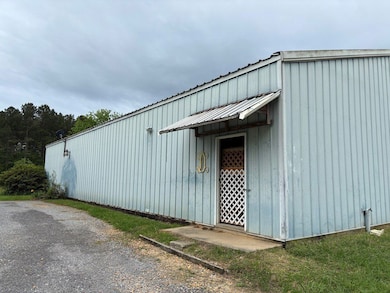
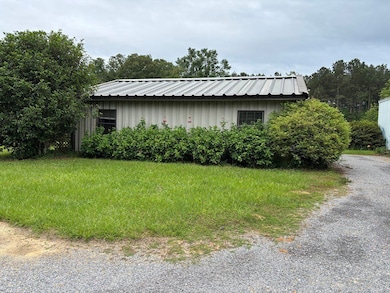
Here it is! Absolute perfect seclusion with a 1/2 mile drive from Hwy 583 to the concrete driveway leading to the large metal building, the guest house, and the Acadian Style home overlooking the 2 acre stocked pond. This oasis of peaceful charm will be a refuge from the noisy life and has countless possibilities for gardens, flowers, animals, farming, and a multitude of other ideas using the space and buildings. The 40 X 80 metal building, the guest house, and the cottage will provide many pleasurable days and secluded refuge. Fishing fun, feeding the birds, and watching wildlife make this 73 acres the haven you have always desired. Come and see...
Copyright 2025 Southwest Mississippi Board of Realtors. All rights reserved. All information provided by the listing agent/broker is deemed reliable but is not guaranteed and should be independently verified.

Home Details
Home Type
- Single Family
Est. Annual Taxes
- $888
Bedrooms and Bathrooms
- 3 Bedrooms
- 3 Full Bathrooms
Additional Features
- Pond
- Current uses include hunting/fishing, row crop
Map
Home Values in the Area
Average Home Value in this Area
Tax History
| Year | Tax Paid | Tax Assessment Tax Assessment Total Assessment is a certain percentage of the fair market value that is determined by local assessors to be the total taxable value of land and additions on the property. | Land | Improvement |
|---|---|---|---|---|
| 2024 | $888 | $14,459 | $0 | $0 |
| 2023 | $888 | $14,584 | $0 | $0 |
| 2022 | $875 | $14,740 | $0 | $0 |
| 2021 | $833 | $14,165 | $0 | $0 |
| 2020 | $849 | $14,321 | $0 | $0 |
| 2019 | $870 | $14,492 | $0 | $0 |
| 2018 | $883 | $14,591 | $0 | $0 |
| 2017 | $811 | $14,043 | $0 | $0 |
| 2016 | $789 | $13,974 | $0 | $0 |
| 2015 | -- | $13,123 | $0 | $0 |
| 2014 | -- | $13,672 | $0 | $0 |
| 2013 | -- | $14,482 | $0 | $0 |
Property History
| Date | Event | Price | List to Sale | Price per Sq Ft |
|---|---|---|---|---|
| 11/25/2025 11/25/25 | For Sale | $550,000 | 0.0% | $353 / Sq Ft |
| 09/17/2025 09/17/25 | Off Market | -- | -- | -- |
| 06/24/2025 06/24/25 | For Sale | $550,000 | -- | $353 / Sq Ft |
- 37 Adron Boyd Rd
- Leonard Rd
- 83 Jayess Rd
- TBD Carters Creek Rd
- 182 Hwy 44 None
- 1095 Eric Price Rd
- 0 Mannings Crossing Rd Unit LotWP001 22974292
- XXX Highway 44
- 0 Hwy 583 N Unit LotWP001 19718421
- 0 Hwy 583 N Unit LotWP001 19718422
- 0 Hwy 583 N Unit LotWP001 19872463
- 161 Old Holmesville Rd
- 869 Old Holmesville Rd
- 7 Willie Roberts Rd
- 0 Matthews Rd
- 0 Beartown Rd
- 222 Log Cabin Rd
- 312 Oak Grove Rd
- 325 Beartown Rd
- 0 C D Rayborn Rd
- 1061 Campground Rd
- 1029 Antler Ln
- 102 N Front St Unit 1
- 420 Howe St
- 516 Northwest Ave
- 403 S Laurel St
- 509 Maxine Ave Unit A
- 840 Marion Ave
- 1300 14th St
- 305 Lawrence St Unit F
- 1328 Parklane Rd
- 1109 Old Brookhaven Rd
- 2083 Martin Rd
- 36339 Louisiana 38
- 2018 Stewart Ln
- 416 N Seventh St Unit B
- 576 Halbert Heights Rd Unit C8
- 800 Magee Dr
- 26450 Choctaw Rd
- 30246 Louisiana 21