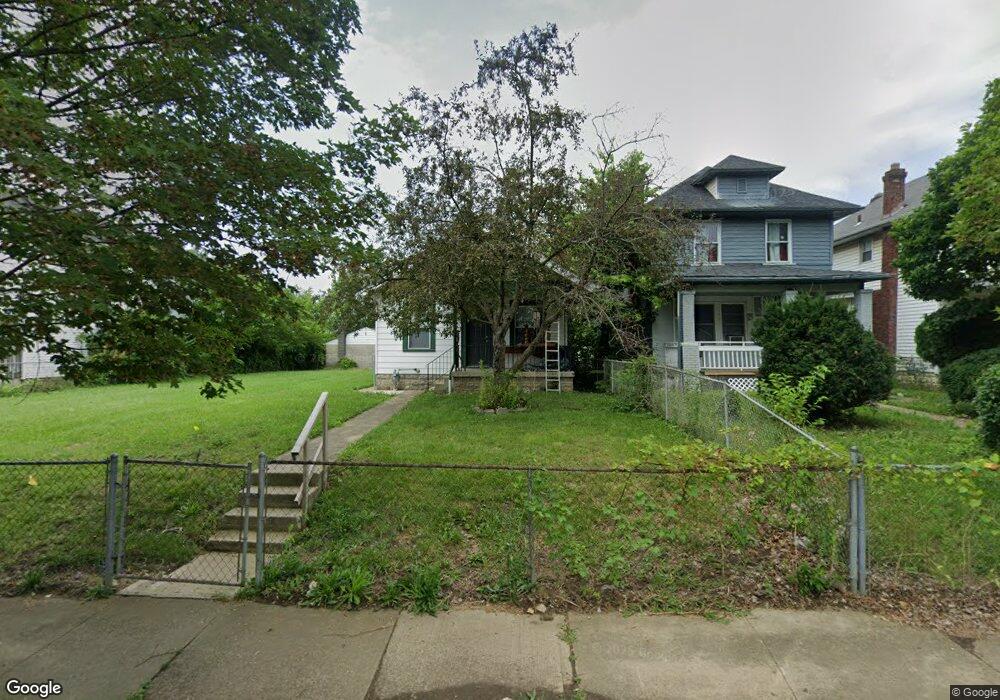
1139 Walters St Columbus, OH 43201
Milo-Grogan NeighborhoodEstimated Value: $83,000 - $145,000
3
Beds
1
Bath
896
Sq Ft
$130/Sq Ft
Est. Value
About This Home
This home is located at 1139 Walters St, Columbus, OH 43201 and is currently estimated at $116,258, approximately $129 per square foot. 1139 Walters St is a home located in Franklin County with nearby schools including Windsor Stem Acadmey, Linden-Mckinley Stem School On Arcadia, and Columbus Performance Academy.
Ownership History
Date
Name
Owned For
Owner Type
Purchase Details
Closed on
Sep 13, 2022
Sold by
Bddr Llc
Bought by
Avondale Homes Llc
Current Estimated Value
Home Financials for this Owner
Home Financials are based on the most recent Mortgage that was taken out on this home.
Original Mortgage
$110,000
Outstanding Balance
$104,990
Interest Rate
5.13%
Mortgage Type
New Conventional
Estimated Equity
$11,268
Purchase Details
Closed on
Apr 20, 2022
Sold by
Johnson Dexter W
Bought by
Bddr Llc
Purchase Details
Closed on
Mar 30, 2022
Sold by
Johnson Dexter W
Bought by
Bddr Llc
Purchase Details
Closed on
Feb 29, 2016
Sold by
Mullins Courtney N
Bought by
Johnson Dexter W
Purchase Details
Closed on
Dec 8, 2015
Sold by
Taylor Barbara J
Bought by
Mullins Courtney N
Purchase Details
Closed on
Sep 30, 2015
Sold by
Taylor Barbara J
Bought by
Mullins Oourtney N
Purchase Details
Closed on
Sep 27, 1999
Sold by
Estate Of Charles Warren Gose
Bought by
Gose Virginia R
Purchase Details
Closed on
May 3, 1983
Bought by
Gose Charles and Gose Virginia R
Create a Home Valuation Report for This Property
The Home Valuation Report is an in-depth analysis detailing your home's value as well as a comparison with similar homes in the area
Home Values in the Area
Average Home Value in this Area
Purchase History
| Date | Buyer | Sale Price | Title Company |
|---|---|---|---|
| Avondale Homes Llc | $75,000 | Apex Title | |
| Bddr Llc | -- | Burchfield James Randolph | |
| Bddr Llc | -- | Burchfield James Randolph | |
| Johnson Dexter W | -- | None Available | |
| Mullins Courtney N | $34,000 | None Available | |
| Mullins Oourtney N | $34,000 | None Available | |
| Gose Virginia R | -- | -- | |
| Gose Charles | $4,000 | -- |
Source: Public Records
Mortgage History
| Date | Status | Borrower | Loan Amount |
|---|---|---|---|
| Open | Avondale Homes Llc | $110,000 |
Source: Public Records
Tax History Compared to Growth
Tax History
| Year | Tax Paid | Tax Assessment Tax Assessment Total Assessment is a certain percentage of the fair market value that is determined by local assessors to be the total taxable value of land and additions on the property. | Land | Improvement |
|---|---|---|---|---|
| 2024 | $1,401 | $30,560 | $6,720 | $23,840 |
| 2023 | $1,421 | $30,555 | $6,720 | $23,835 |
| 2022 | $1,519 | $16,040 | $4,310 | $11,730 |
| 2021 | $1,036 | $16,040 | $4,310 | $11,730 |
| 2020 | $1,052 | $16,040 | $4,310 | $11,730 |
| 2019 | $864 | $13,900 | $3,750 | $10,150 |
| 2018 | $748 | $13,900 | $3,750 | $10,150 |
| 2017 | $891 | $13,900 | $3,750 | $10,150 |
| 2016 | $878 | $12,150 | $3,430 | $8,720 |
| 2015 | $692 | $12,150 | $3,430 | $8,720 |
| 2014 | $753 | $12,150 | $3,430 | $8,720 |
| 2013 | $413 | $13,510 | $3,815 | $9,695 |
Source: Public Records
Map
Nearby Homes
- 1025 Howard St
- 1082-1084 Peters Ave
- 940 Shoemaker Ave
- 911 Camden Ave
- 780-782 Gibbard Ave
- 796 Gibbard Ave
- 923 Camden Ave
- 940-942 Leona Ave
- 927 Camden Ave
- 997-999 Gibbard Ave
- 779 Gibbard Ave
- 1186 Saint Clair Ave
- 810-812 E 3rd Ave
- 773-775 E 3rd Ave
- 0 E 4th Ave
- 276 E 4th Ave
- 790-792 E Starr Ave
- 841 Saint Clair Ave
- 570 Reynolds Ave
- 574 Reynolds Ave Unit 6
- 1143 Walters St
- 1129 Walters St
- 1147 Walters St
- 1149 Walters St Unit 151
- 1149-1151 Walters St
- 1119 Walters St
- 1155 Walters St
- 1115 Walters St
- 1115 Walters St Unit A&B
- 1146 Sidney St
- 1142 Sidney St
- 1152 Sidney St
- 1138 Sidney St
- 1136 Walters St
- 1161 Walters St
- 1113 Walters St
- 1142 Walters St
- 1160 Sidney St
- 1150 Walters St
- 1162 Sidney St