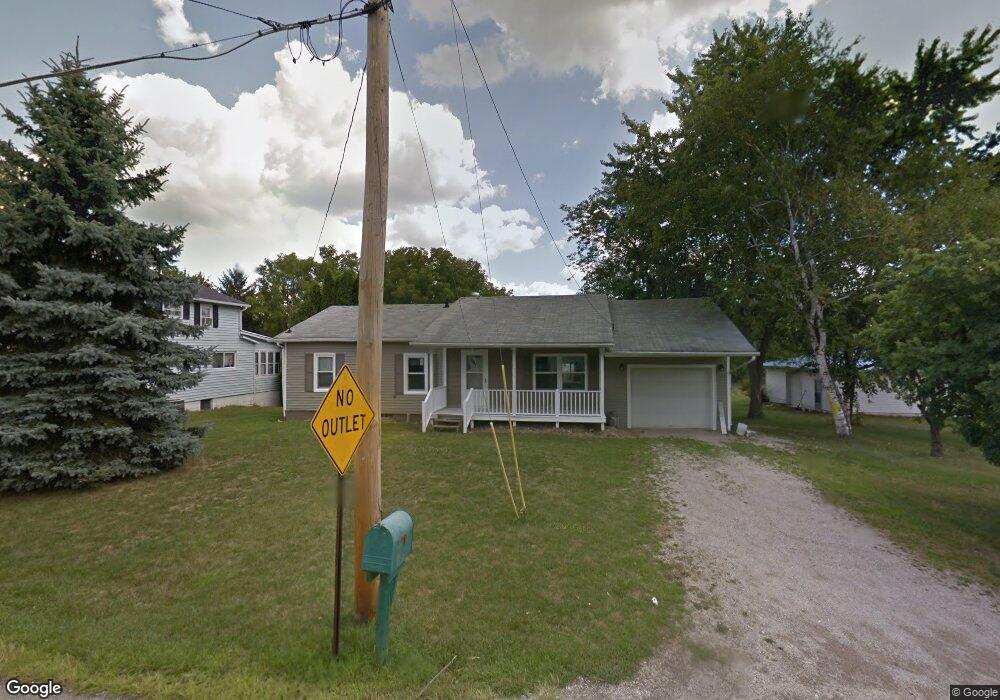
1139 Wick Ave Ashland, OH 44805
Estimated Value: $145,000 - $162,000
3
Beds
2
Baths
1,176
Sq Ft
$131/Sq Ft
Est. Value
About This Home
This home is located at 1139 Wick Ave, Ashland, OH 44805 and is currently estimated at $153,614, approximately $130 per square foot. 1139 Wick Ave is a home located in Ashland County with nearby schools including Ashland High School, Ashland County Community Academy, and St. Edward Elementary School.
Ownership History
Date
Name
Owned For
Owner Type
Purchase Details
Closed on
Nov 5, 2012
Sold by
Robert Eslie
Bought by
Baum Jayson L and Baum Elizabeth B
Current Estimated Value
Home Financials for this Owner
Home Financials are based on the most recent Mortgage that was taken out on this home.
Original Mortgage
$78,452
Outstanding Balance
$53,521
Interest Rate
3.5%
Mortgage Type
FHA
Estimated Equity
$100,093
Purchase Details
Closed on
Apr 6, 2011
Purchase Details
Closed on
Mar 3, 2011
Sold by
Flory Jerry D
Purchase Details
Closed on
May 10, 1988
Bought by
Flory Jerry D
Create a Home Valuation Report for This Property
The Home Valuation Report is an in-depth analysis detailing your home's value as well as a comparison with similar homes in the area
Home Values in the Area
Average Home Value in this Area
Purchase History
| Date | Buyer | Sale Price | Title Company |
|---|---|---|---|
| Baum Jayson L | $79,900 | -- | |
| -- | -- | -- | |
| -- | $49,300 | -- | |
| Flory Jerry D | $18,000 | -- |
Source: Public Records
Mortgage History
| Date | Status | Borrower | Loan Amount |
|---|---|---|---|
| Open | Baum Jayson L | $78,452 |
Source: Public Records
Tax History
| Year | Tax Paid | Tax Assessment Tax Assessment Total Assessment is a certain percentage of the fair market value that is determined by local assessors to be the total taxable value of land and additions on the property. | Land | Improvement |
|---|---|---|---|---|
| 2025 | $1,221 | $35,340 | $6,570 | $28,770 |
| 2024 | $1,221 | $35,340 | $6,570 | $28,770 |
| 2023 | $1,221 | $35,340 | $6,570 | $28,770 |
| 2022 | $1,342 | $30,730 | $5,710 | $25,020 |
| 2021 | $1,347 | $30,730 | $5,710 | $25,020 |
| 2020 | $1,275 | $30,730 | $5,710 | $25,020 |
| 2019 | $1,286 | $28,680 | $7,690 | $20,990 |
| 2018 | $1,297 | $28,680 | $7,690 | $20,990 |
| 2017 | $1,295 | $28,680 | $7,690 | $20,990 |
| 2016 | $1,295 | $27,320 | $7,330 | $19,990 |
| 2015 | $1,284 | $27,320 | $7,330 | $19,990 |
| 2013 | $1,684 | $35,320 | $7,320 | $28,000 |
Source: Public Records
Map
Nearby Homes
- 1218 Myers Ave
- 304 Prospect St
- 515 Sandusky St
- 416-418 Carroll St
- 1471 Troy Rd
- 427 W Main St
- 917 Union St
- 237 E 9th St
- 1411 Orange Rd
- 224 Sharon Ave
- 219 W Washington St
- 1520 Orange Rd Unit 22
- 1520 Orange Rd
- 259 E 3rd St
- 162 Arthur's Ct
- 318 Miller St
- 318 Miller Rear St
- 703 Grant St
- 711 Grant St
- 0 Virginia Ave Unit 230908
Your Personal Tour Guide
Ask me questions while you tour the home.