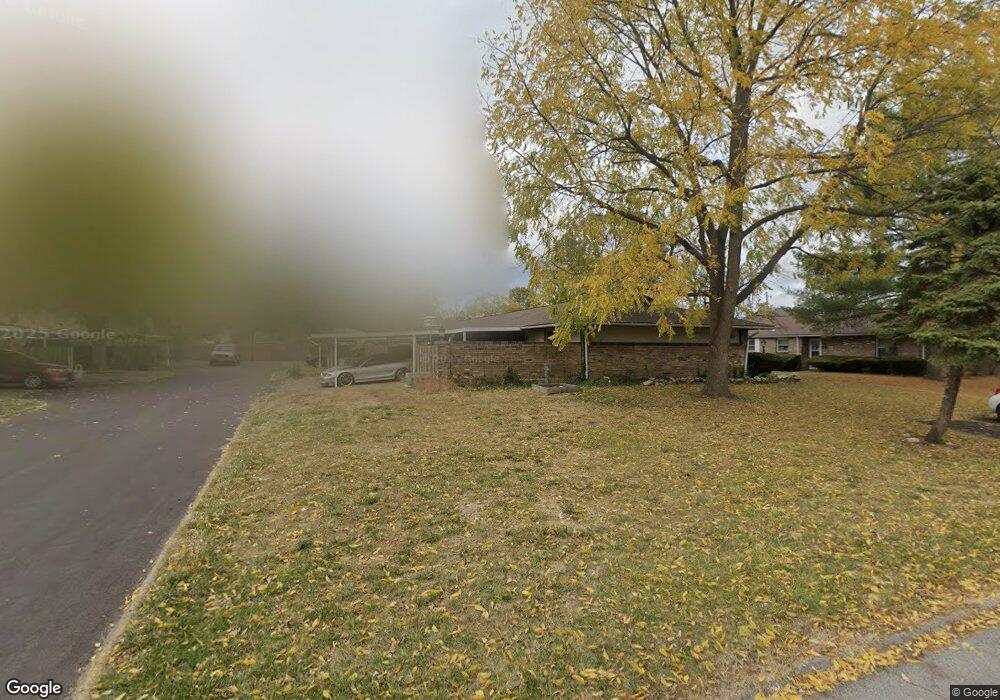
1139 Woodbrook Cir W Unit A Columbus, OH 43223
Brookshire NeighborhoodEstimated Value: $102,000 - $112,000
2
Beds
1
Bath
858
Sq Ft
$123/Sq Ft
Est. Value
About This Home
This home is located at 1139 Woodbrook Cir W Unit A, Columbus, OH 43223 and is currently estimated at $105,634, approximately $123 per square foot. 1139 Woodbrook Cir W Unit A is a home located in Franklin County with nearby schools including Lindbergh Elementary School, Hilltonia Middle School, and Briggs High School.
Ownership History
Date
Name
Owned For
Owner Type
Purchase Details
Closed on
Aug 20, 2022
Sold by
Masters Kitty E
Bought by
Giles Randy M
Current Estimated Value
Home Financials for this Owner
Home Financials are based on the most recent Mortgage that was taken out on this home.
Original Mortgage
$85,500
Outstanding Balance
$81,550
Interest Rate
5.22%
Mortgage Type
New Conventional
Estimated Equity
$24,084
Purchase Details
Closed on
Mar 24, 2022
Sold by
Woolf Sandra M
Bought by
Masters Kitty E
Purchase Details
Closed on
Feb 2, 2022
Sold by
Woolf Sandra M
Bought by
Masters Kitty E
Purchase Details
Closed on
Mar 12, 2012
Sold by
Woolf Leander C and Woofl Sandra Mae
Bought by
Masters Kitty E
Purchase Details
Closed on
Oct 2, 2009
Sold by
Brewster Randall Ii S
Bought by
Woolf Leander C
Purchase Details
Closed on
Dec 4, 1973
Bought by
Chambers Delores C
Create a Home Valuation Report for This Property
The Home Valuation Report is an in-depth analysis detailing your home's value as well as a comparison with similar homes in the area
Home Values in the Area
Average Home Value in this Area
Purchase History
| Date | Buyer | Sale Price | Title Company |
|---|---|---|---|
| Giles Randy M | $90,000 | Crown Search Box | |
| Masters Kitty E | $31,200 | Sabol Law Office | |
| Masters Kitty E | $31,200 | Sabol Law Office | |
| Masters Kitty E | $36,000 | Attorney | |
| Woolf Leander C | $42,500 | Chase Title | |
| Chambers Delores C | -- | -- |
Source: Public Records
Mortgage History
| Date | Status | Borrower | Loan Amount |
|---|---|---|---|
| Open | Giles Randy M | $85,500 |
Source: Public Records
Tax History Compared to Growth
Tax History
| Year | Tax Paid | Tax Assessment Tax Assessment Total Assessment is a certain percentage of the fair market value that is determined by local assessors to be the total taxable value of land and additions on the property. | Land | Improvement |
|---|---|---|---|---|
| 2024 | $1,356 | $30,210 | $5,250 | $24,960 |
| 2023 | $1,339 | $30,205 | $5,250 | $24,955 |
| 2022 | $580 | $10,920 | $1,540 | $9,380 |
| 2021 | $581 | $10,920 | $1,540 | $9,380 |
| 2020 | $582 | $10,920 | $1,540 | $9,380 |
| 2019 | $542 | $8,720 | $1,230 | $7,490 |
| 2018 | $278 | $8,720 | $1,230 | $7,490 |
| 2017 | $542 | $8,720 | $1,230 | $7,490 |
| 2016 | $611 | $9,000 | $1,580 | $7,420 |
| 2015 | $15 | $9,000 | $1,580 | $7,420 |
| 2014 | $15 | $9,000 | $1,580 | $7,420 |
| 2013 | $37 | $9,975 | $1,750 | $8,225 |
Source: Public Records
Map
Nearby Homes
- 1119 Hardesty Place E Unit 1
- 2382 Hardesty Dr S Unit Q-5
- 1085 Hardesty Place E Unit 4
- 2337 Hardesty Ct Unit 1
- 2436 Hardesty Dr S Unit 4
- 2336 Woodbrook Cir N Unit 92 B
- 2322 Hardesty Ct Unit I11
- 2334 Hardesty Ct Unit 5
- 2367 Hardesty Dr N Unit 1-1
- 1258 Woodbrook Cir W Unit 199
- 2547 Rosedale Ave
- 2180 Eakin Rd
- 2491 Vanderberg Ave
- 2610 Spaatz Ave
- 2530 Vanderberg Ave
- 2538 Vanderberg Ave
- 815 S Wayne Ave
- 0 S Central Ave
- 2579 Eakin Rd
- 2210 October Ridge Dr
- 1139 Woodbrook Cir W
- 1139 Woodbrook Cir W Unit 68
- 1139 Woodbrook Cir W
- 1139 Woodbrook Cir W Unit 65
- 1139 Woodbrook Cir W Unit D
- 1127 Woodbrook Cir W Unit 72
- 1127 Woodbrook Cir W Unit B
- 1127 Woodbrook Cir W Unit 70
- 1127 Woodbrook Cir W Unit 69
- 1127 Woodbrook Cir W Unit C
- 1127 Woodbrook Cir W Unit D
- 1149 Woodbrook Cir W Unit 62
- 1149 Woodbrook Cir W Unit 63
- 1149 Woodbrook Cir W
- 1149 Woodbrook Cir W Unit 64
- 1149 Woodbrook Cir W Unit A
- 1149 Woodbrook Cir W Unit C
- 1149 Woodbrook Cir W Unit B
- 1161 Woodbrook Cir W Unit A
- 1161 Woodbrook Cir W