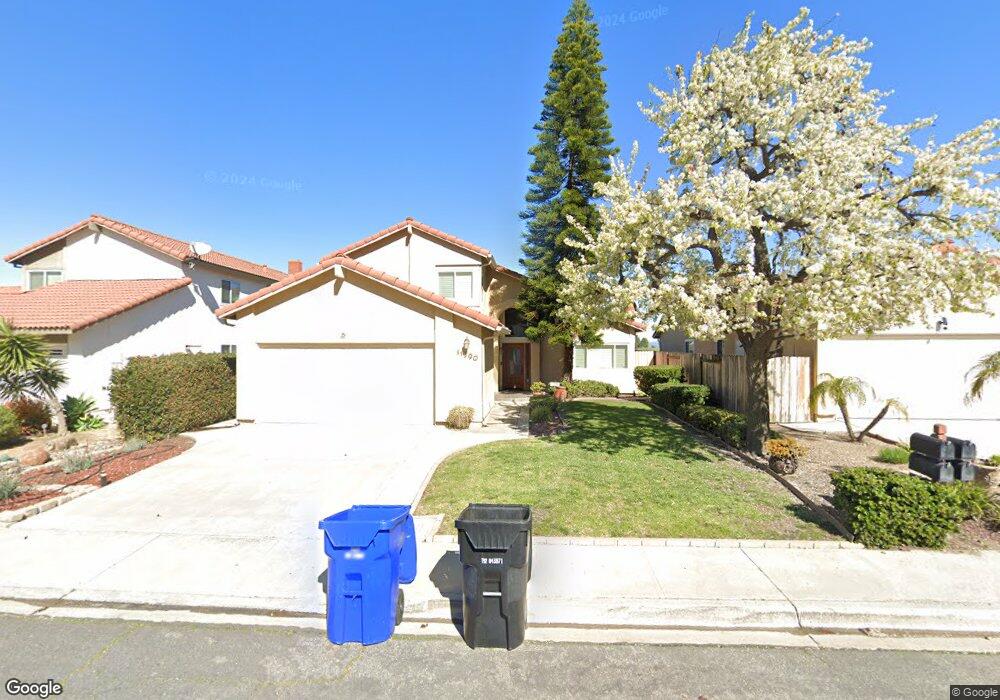
11390 Turtleback Ln San Diego, CA 92127
Rancho Bernardo NeighborhoodEstimated Value: $1,297,000 - $1,428,000
4
Beds
2
Baths
1,940
Sq Ft
$698/Sq Ft
Est. Value
About This Home
This home is located at 11390 Turtleback Ln, San Diego, CA 92127 and is currently estimated at $1,354,688, approximately $698 per square foot. 11390 Turtleback Ln is a home located in San Diego County with nearby schools including Turtleback Elementary, Bernardo Heights Middle, and Rancho Bernardo High.
Ownership History
Date
Name
Owned For
Owner Type
Purchase Details
Closed on
Feb 23, 2017
Sold by
Skaggs Crawford B and Skaggs Carla D
Bought by
Liu Wayne C and Jiang Grace
Current Estimated Value
Home Financials for this Owner
Home Financials are based on the most recent Mortgage that was taken out on this home.
Original Mortgage
$365,000
Outstanding Balance
$296,102
Interest Rate
3.5%
Mortgage Type
Adjustable Rate Mortgage/ARM
Estimated Equity
$1,058,586
Purchase Details
Closed on
Nov 26, 2003
Sold by
Skaggs Crawford B and Skaggs Carla D
Bought by
Skaggs Crawford B and Skaggs Carla D
Purchase Details
Closed on
Jun 22, 1994
Sold by
Targia Joseph and Targia Valerie D
Bought by
Skaggs Crawford B and Skaggs Carla D
Home Financials for this Owner
Home Financials are based on the most recent Mortgage that was taken out on this home.
Original Mortgage
$210,900
Interest Rate
7.75%
Create a Home Valuation Report for This Property
The Home Valuation Report is an in-depth analysis detailing your home's value as well as a comparison with similar homes in the area
Home Values in the Area
Average Home Value in this Area
Purchase History
| Date | Buyer | Sale Price | Title Company |
|---|---|---|---|
| Liu Wayne C | $775,000 | Lawyers Title | |
| Skaggs Crawford B | -- | -- | |
| Skaggs Crawford B | $222,000 | First American Title Co |
Source: Public Records
Mortgage History
| Date | Status | Borrower | Loan Amount |
|---|---|---|---|
| Open | Liu Wayne C | $365,000 | |
| Previous Owner | Skaggs Crawford B | $210,900 |
Source: Public Records
Tax History Compared to Growth
Tax History
| Year | Tax Paid | Tax Assessment Tax Assessment Total Assessment is a certain percentage of the fair market value that is determined by local assessors to be the total taxable value of land and additions on the property. | Land | Improvement |
|---|---|---|---|---|
| 2025 | $9,903 | $899,446 | $311,950 | $587,496 |
| 2024 | $9,903 | $881,811 | $305,834 | $575,977 |
| 2023 | $9,692 | $864,522 | $299,838 | $564,684 |
| 2022 | $9,529 | $847,571 | $293,959 | $553,612 |
| 2021 | $9,404 | $830,953 | $288,196 | $542,757 |
| 2020 | $9,276 | $822,433 | $285,241 | $537,192 |
| 2019 | $9,034 | $806,308 | $279,649 | $526,659 |
| 2018 | $8,778 | $790,499 | $274,166 | $516,333 |
| 2017 | $3,527 | $321,275 | $111,427 | $209,848 |
| 2016 | $3,453 | $314,977 | $109,243 | $205,734 |
| 2015 | $3,401 | $310,247 | $107,603 | $202,644 |
| 2014 | $3,321 | $304,171 | $105,496 | $198,675 |
Source: Public Records
Map
Nearby Homes
- 16096 Caminito Tomas
- 11781 Caminito de Las Missiones
- 16244 Avenida Venusto Unit A
- 16232 Avenida Venusto Unit B
- 16430 Avenida Venusto Unit D
- 16464 Avenida Venusto Unit C
- 11705 Via Medanos
- 15273 Maturin Dr Unit 40
- 15865 Lofty Trail Dr Unit 313-372-24-00
- 15373 Maturin Dr Unit 178
- 16396 Avenida Suavidad
- 15283 Maturin Dr Unit 62
- 16205 Via Embeleso
- 12115 Caddy Row
- 11251 Avenida de Los Lobos Unit D
- 11239 Avenida de Los Lobos Unit D
- 12131 View Pointe Row
- 12047 Avenida Consentido
- 11941 Callado Rd
- 12105 View Pointe Row
- 11398 Turtleback Ln
- 11382 Turtleback Ln
- 11404 Turtleback Ln
- 11374 Turtleback Ln
- 11410 Turtleback Ln
- 11416 Turtleback Ln
- 11393 Turtleback Ln
- 11399 Turtleback Ln
- 11387 Turtleback Ln
- 11358 Turtleback Ln
- 11405 Turtleback Ln
- 11381 Turtleback Ln
- 11411 Turtleback Ln Unit 2
- 11373 Turtleback Ln
- 11422 Turtleback Ln
- 11350 Turtleback Ln
- 11365 Turtleback Ln
- 11417 Turtleback Ln
- 11357 Turtleback Ln
- 11428 Turtleback Ln