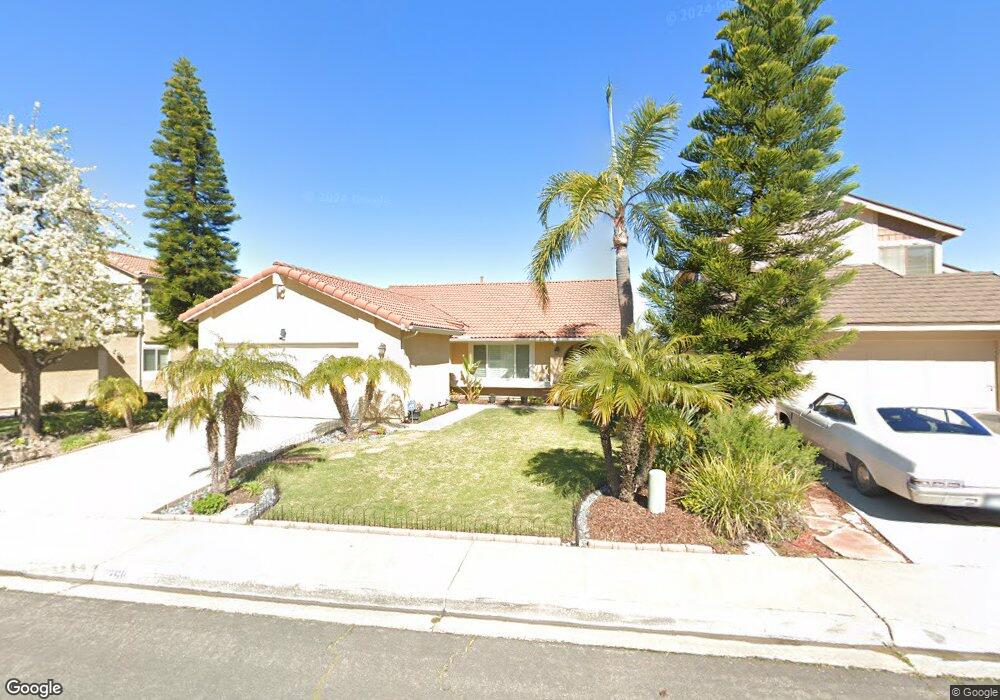
11398 Turtleback Ln San Diego, CA 92127
Rancho Bernardo NeighborhoodEstimated Value: $1,119,000 - $1,393,000
3
Beds
2
Baths
1,528
Sq Ft
$798/Sq Ft
Est. Value
About This Home
This home is located at 11398 Turtleback Ln, San Diego, CA 92127 and is currently estimated at $1,219,551, approximately $798 per square foot. 11398 Turtleback Ln is a home located in San Diego County with nearby schools including Turtleback Elementary, Bernardo Heights Middle, and Rancho Bernardo High.
Ownership History
Date
Name
Owned For
Owner Type
Purchase Details
Closed on
Apr 17, 2017
Sold by
Chan Joseph and Chan Regina
Bought by
Kiai Jasmine L
Current Estimated Value
Home Financials for this Owner
Home Financials are based on the most recent Mortgage that was taken out on this home.
Original Mortgage
$611,000
Outstanding Balance
$506,906
Interest Rate
4.1%
Mortgage Type
New Conventional
Estimated Equity
$712,645
Purchase Details
Closed on
Oct 1, 2009
Sold by
Rinaldo Catherine and Britt Melinda R
Bought by
Chan Joseph and Chan Regina
Home Financials for this Owner
Home Financials are based on the most recent Mortgage that was taken out on this home.
Original Mortgage
$180,000
Interest Rate
4.38%
Mortgage Type
New Conventional
Purchase Details
Closed on
Apr 30, 1998
Sold by
Carter Craig S
Bought by
Risaldo Catherine and Britt Melinda Rae
Home Financials for this Owner
Home Financials are based on the most recent Mortgage that was taken out on this home.
Original Mortgage
$193,600
Interest Rate
7.13%
Purchase Details
Closed on
Aug 31, 1990
Purchase Details
Closed on
Mar 30, 1984
Create a Home Valuation Report for This Property
The Home Valuation Report is an in-depth analysis detailing your home's value as well as a comparison with similar homes in the area
Home Values in the Area
Average Home Value in this Area
Purchase History
| Date | Buyer | Sale Price | Title Company |
|---|---|---|---|
| Kiai Jasmine L | $650,000 | Fidelity National Title Co | |
| Chan Joseph | $486,000 | Equity Title San Diego | |
| Risaldo Catherine | $242,000 | Chicago Title Co | |
| -- | $219,000 | -- | |
| -- | $125,000 | -- |
Source: Public Records
Mortgage History
| Date | Status | Borrower | Loan Amount |
|---|---|---|---|
| Open | Kiai Jasmine L | $611,000 | |
| Previous Owner | Chan Joseph | $180,000 | |
| Previous Owner | Risaldo Catherine | $193,600 |
Source: Public Records
Tax History Compared to Growth
Tax History
| Year | Tax Paid | Tax Assessment Tax Assessment Total Assessment is a certain percentage of the fair market value that is determined by local assessors to be the total taxable value of land and additions on the property. | Land | Improvement |
|---|---|---|---|---|
| 2025 | $8,381 | $754,373 | $543,276 | $211,097 |
| 2024 | $8,381 | $739,582 | $532,624 | $206,958 |
| 2023 | $8,203 | $725,081 | $522,181 | $202,900 |
| 2022 | $8,067 | $710,865 | $511,943 | $198,922 |
| 2021 | $7,962 | $696,927 | $501,905 | $195,022 |
| 2020 | $7,855 | $689,782 | $496,759 | $193,023 |
| 2019 | $7,651 | $676,258 | $487,019 | $189,239 |
| 2018 | $7,437 | $662,999 | $477,470 | $185,529 |
| 2017 | $83 | $540,524 | $389,267 | $151,257 |
| 2016 | $5,905 | $529,927 | $381,635 | $148,292 |
| 2015 | $5,818 | $521,968 | $375,903 | $146,065 |
| 2014 | $5,552 | $500,000 | $357,000 | $143,000 |
Source: Public Records
Map
Nearby Homes
- 11781 Caminito de Las Missiones
- 16003 Caminito de Linda
- 16232 Avenida Venusto Unit B
- 16244 Avenida Venusto Unit A
- 16430 Avenida Venusto Unit D
- 15353 Maturin Dr Unit 115
- 11705 Via Medanos
- 15273 Maturin Dr Unit 40
- 15373 Maturin Dr Unit 178
- 15283 Maturin Dr Unit 62
- 16205 Via Embeleso
- 11313 Avenida de Los Lobos Unit B
- 11263 Avenida de Los Lobos Unit D
- 12141 Iron View Row
- 12047 Avenida Consentido
- 12105 View Pointe Row
- 16731 Acena Dr
- 15610 Corte Raposo
- 12085 Calle de Maria
- 12325 Fairway Pointe Row
- 11390 Turtleback Ln
- 11404 Turtleback Ln
- 11382 Turtleback Ln
- 11410 Turtleback Ln
- 11416 Turtleback Ln
- 11374 Turtleback Ln
- 11399 Turtleback Ln
- 11405 Turtleback Ln
- 11422 Turtleback Ln
- 11393 Turtleback Ln
- 11366 Turtleback Ln
- 11411 Turtleback Ln Unit 2
- 11387 Turtleback Ln
- 11417 Turtleback Ln
- 11381 Turtleback Ln
- 11358 Turtleback Ln
- 11428 Turtleback Ln
- 11373 Turtleback Ln
- 11423 Turtleback Ln
- 11350 Turtleback Ln