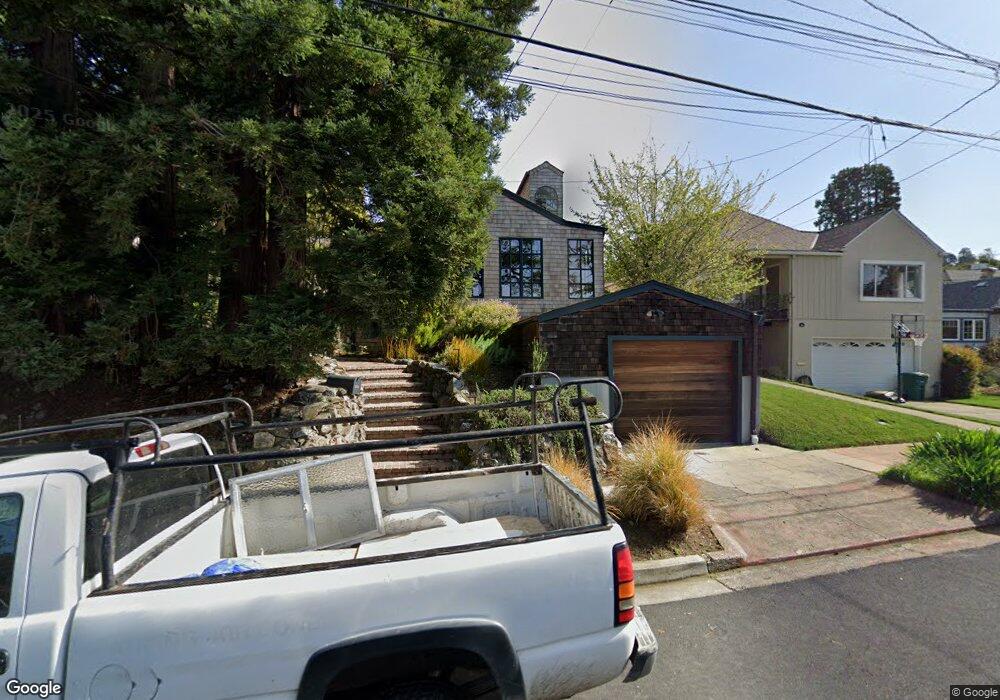
114 Ardmore Rd Kensington, CA 94707
Estimated Value: $1,505,000 - $1,861,000
3
Beds
3
Baths
2,521
Sq Ft
$670/Sq Ft
Est. Value
About This Home
This home is located at 114 Ardmore Rd, Kensington, CA 94707 and is currently estimated at $1,690,297, approximately $670 per square foot. 114 Ardmore Rd is a home located in Contra Costa County with nearby schools including Kensington Elementary School, Fred T. Korematsu Middle School, and El Cerrito Senior High School.
Ownership History
Date
Name
Owned For
Owner Type
Purchase Details
Closed on
Jul 11, 2017
Sold by
Ribet Kenneth Alan and Goldberg Lisa Robin
Bought by
Ribet Kenneth Alan and Goldberg Lisa Robin
Current Estimated Value
Purchase Details
Closed on
Jan 11, 1996
Sold by
Ribet Kenneth A
Bought by
Ribet Kenneth A and Ribet Lisa
Home Financials for this Owner
Home Financials are based on the most recent Mortgage that was taken out on this home.
Original Mortgage
$180,000
Interest Rate
7.38%
Mortgage Type
Purchase Money Mortgage
Purchase Details
Closed on
Jan 8, 1996
Sold by
Ribet Lisa
Bought by
Ribet Kenneth A
Home Financials for this Owner
Home Financials are based on the most recent Mortgage that was taken out on this home.
Original Mortgage
$180,000
Interest Rate
7.38%
Mortgage Type
Purchase Money Mortgage
Create a Home Valuation Report for This Property
The Home Valuation Report is an in-depth analysis detailing your home's value as well as a comparison with similar homes in the area
Home Values in the Area
Average Home Value in this Area
Purchase History
| Date | Buyer | Sale Price | Title Company |
|---|---|---|---|
| Ribet Kenneth Alan | -- | None Available | |
| Ribet Kenneth A | -- | -- | |
| Ribet Kenneth A | $90,000 | Chicago Title Co |
Source: Public Records
Mortgage History
| Date | Status | Borrower | Loan Amount |
|---|---|---|---|
| Closed | Ribet Kenneth A | $180,000 |
Source: Public Records
Tax History Compared to Growth
Tax History
| Year | Tax Paid | Tax Assessment Tax Assessment Total Assessment is a certain percentage of the fair market value that is determined by local assessors to be the total taxable value of land and additions on the property. | Land | Improvement |
|---|---|---|---|---|
| 2025 | $12,886 | $885,193 | $380,150 | $505,043 |
| 2024 | $12,647 | $867,838 | $372,697 | $495,141 |
| 2023 | $12,647 | $850,823 | $365,390 | $485,433 |
| 2022 | $12,459 | $834,141 | $358,226 | $475,915 |
| 2021 | $12,403 | $817,786 | $351,202 | $466,584 |
| 2019 | $11,660 | $793,532 | $340,786 | $452,746 |
| 2018 | $11,263 | $777,973 | $334,104 | $443,869 |
| 2017 | $11,082 | $762,719 | $327,553 | $435,166 |
| 2016 | $11,040 | $747,765 | $321,131 | $426,634 |
| 2015 | $11,075 | $736,534 | $316,308 | $420,226 |
| 2014 | $10,928 | $722,107 | $310,112 | $411,995 |
Source: Public Records
Map
Nearby Homes
- 700 Coventry Rd
- 716 Coventry Rd
- 201 Amherst Ave
- 139 Arlington Ave
- 380 Vermont Ave
- 581 Arlington Ave
- 267 Columbia Ave
- 566 The Alameda
- 479 Vermont Ave
- 1922 San Antonio Ave
- 411 Vassar Ave
- 1951 San Antonio Ave
- 265 Willamette Ave
- 479 Kentucky Ave
- 1 Dewey Rd
- 545 Colusa Ave
- 45 Alta Rd
- 63 Eureka Ave
- 1998 San Antonio Ave
- 605 Plateau Dr