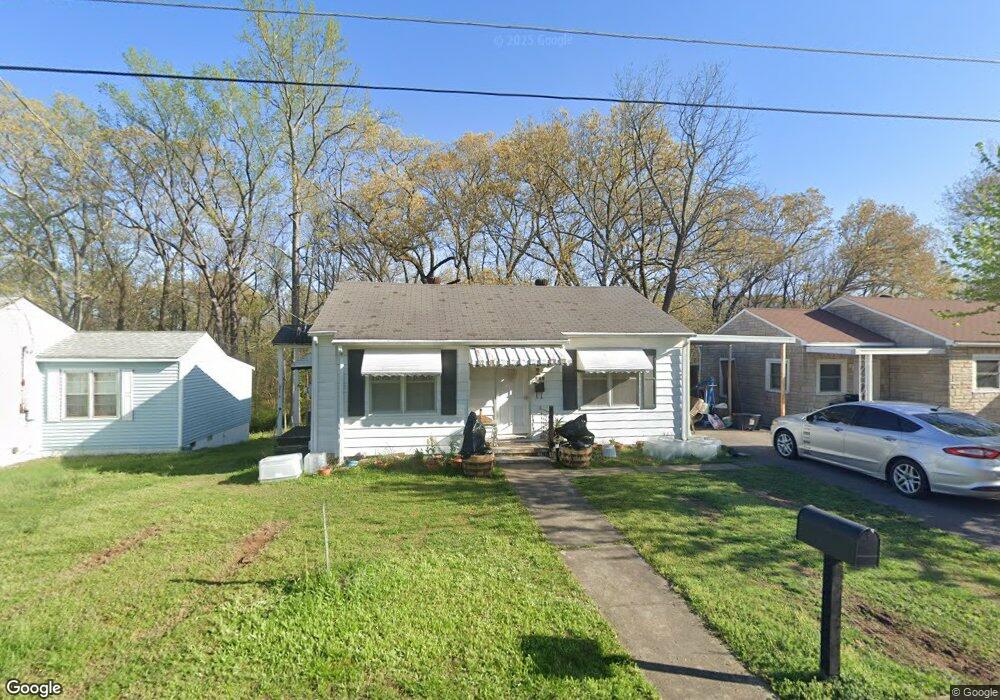
114 Davidson St Camden, TN 38320
Estimated Value: $72,381 - $102,000
Studio
1
Bath
849
Sq Ft
$101/Sq Ft
Est. Value
About This Home
This home is located at 114 Davidson St, Camden, TN 38320 and is currently estimated at $85,595, approximately $100 per square foot. 114 Davidson St is a home located in Benton County with nearby schools including Camden Elementary School, Briarwood School, and Camden Junior High School.
Ownership History
Date
Name
Owned For
Owner Type
Purchase Details
Closed on
Jun 14, 2021
Sold by
Wyatt David B and Wyatt Nancy J
Bought by
Dowell James Allen
Current Estimated Value
Home Financials for this Owner
Home Financials are based on the most recent Mortgage that was taken out on this home.
Original Mortgage
$50,000
Outstanding Balance
$45,170
Interest Rate
2.9%
Mortgage Type
New Conventional
Estimated Equity
$40,425
Purchase Details
Closed on
Mar 12, 2019
Sold by
Wyatt David B
Bought by
Wyatt David B and Wyatt Nancy J
Purchase Details
Closed on
Oct 17, 2018
Sold by
Wyatt James L
Bought by
Wyatt James L and Wyatt David B
Purchase Details
Closed on
Jul 28, 2014
Sold by
Holland Dora Jean Wyatt
Bought by
Wyatt James L and Wyatt David B Wyatt
Purchase Details
Closed on
Sep 12, 2007
Sold by
Holland Dora Jean
Bought by
Wyatt James Lynn
Purchase Details
Closed on
Sep 8, 1997
Sold by
Bain George Lindell
Bought by
Holland Dora Jean
Create a Home Valuation Report for This Property
The Home Valuation Report is an in-depth analysis detailing your home's value as well as a comparison with similar homes in the area
Home Values in the Area
Average Home Value in this Area
Purchase History
| Date | Buyer | Sale Price | Title Company |
|---|---|---|---|
| Dowell James Allen | $50,000 | None Available | |
| Wyatt David B | -- | -- | |
| Wyatt James L | $9,000 | -- | |
| Wyatt James L | -- | -- | |
| Wyatt James Lynn | $23,900 | -- | |
| Holland Dora Jean | $7,000 | -- |
Source: Public Records
Mortgage History
| Date | Status | Borrower | Loan Amount |
|---|---|---|---|
| Open | Dowell James Allen | $50,000 |
Source: Public Records
Tax History
| Year | Tax Paid | Tax Assessment Tax Assessment Total Assessment is a certain percentage of the fair market value that is determined by local assessors to be the total taxable value of land and additions on the property. | Land | Improvement |
|---|---|---|---|---|
| 2025 | $425 | $18,150 | $2,775 | $15,375 |
| 2024 | $404 | $11,025 | $1,250 | $9,775 |
| 2023 | $404 | $11,025 | $1,250 | $9,775 |
| 2022 | $302 | $8,250 | $1,250 | $7,000 |
| 2021 | $302 | $8,250 | $1,250 | $7,000 |
| 2020 | $270 | $7,350 | $1,250 | $6,100 |
| 2019 | $303 | $7,650 | $1,250 | $6,400 |
| 2018 | $303 | $7,650 | $1,250 | $6,400 |
| 2017 | $283 | $7,650 | $1,250 | $6,400 |
| 2016 | $283 | $7,150 | $1,250 | $5,900 |
| 2015 | $285 | $7,150 | $1,250 | $5,900 |
| 2014 | $254 | $7,150 | $1,250 | $5,900 |
| 2013 | $254 | $6,454 | $0 | $0 |
Source: Public Records
Map
Nearby Homes
- 0 Forrest Ave N
- 181 Washington Ave
- 0 Higdon Ck Rd Unit RTC2993447
- 130 Mimosa St
- 134 N Church Ave
- 130 Turnpike Ave
- 147 Berry St
- 241 Stigall St
- 876 Flatwoods Rd
- 273 Washington Ave
- 120 Magnolia St
- 0 George St
- 0 Longview St
- 6100 Old Highway 69s
- 122 W Lake St
- 1 Maple Ave
- 00 Flatwoods Rd
- 000 Laveta Ln
- 113 S Forrest Ave
- 170 Westview St
- 116 Davidson St
- 112 Davidson St
- 118 Davidson St
- 110 Davidson St
- 120 Davidson St
- 108 Davidson St
- 115 Davidson St
- 113 Davidson St
- 117 Davidson St
- 119 Davidson St
- 122 Davidson St
- 109 Davidson St
- 121 Davidson St
- 211 Woodside St
- 210 Hillcrest Ave
- 213 Woodside St
- 208 Hillcrest Ave
- 206 Hillcrest Ave
- 125 Davidson St
- 211 Hillcrest Ave
Your Personal Tour Guide
Ask me questions while you tour the home.