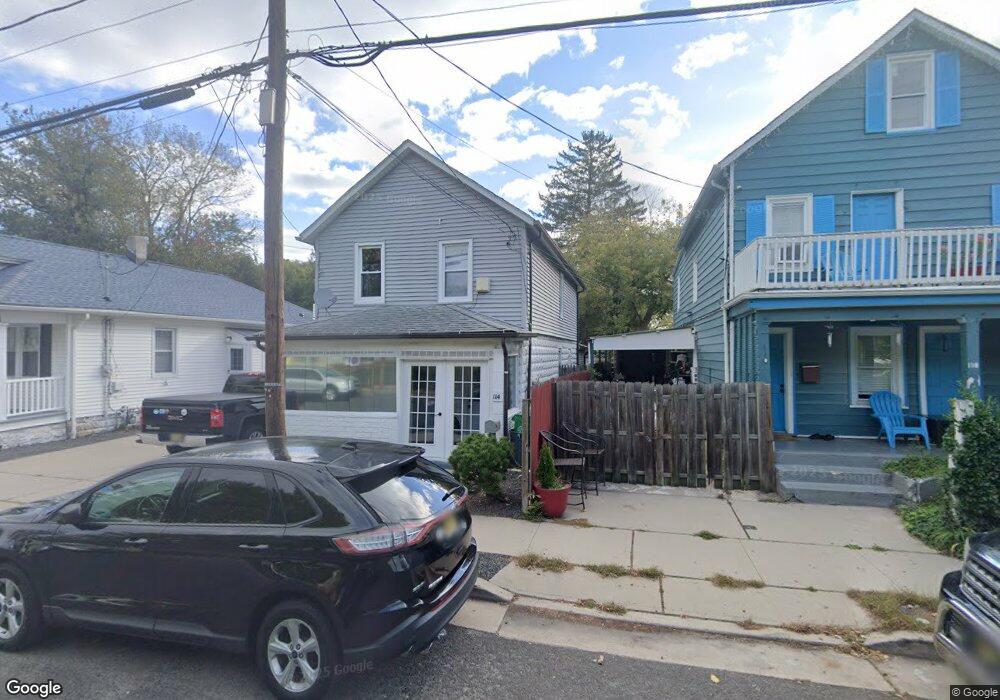
114 Dewitt Ave Asbury Park, NJ 07712
Estimated Value: $362,000 - $534,000
3
Beds
2
Baths
1,305
Sq Ft
$349/Sq Ft
Est. Value
About This Home
This home is located at 114 Dewitt Ave, Asbury Park, NJ 07712 and is currently estimated at $454,798, approximately $348 per square foot. 114 Dewitt Ave is a home located in Monmouth County with nearby schools including Asbury Park High School and Our Lady of Mount Carmel School.
Ownership History
Date
Name
Owned For
Owner Type
Purchase Details
Closed on
Jul 20, 2009
Sold by
Emc Mortgage Corporation
Bought by
Cruz Moises and Segovia Rocio
Current Estimated Value
Home Financials for this Owner
Home Financials are based on the most recent Mortgage that was taken out on this home.
Original Mortgage
$78,551
Outstanding Balance
$51,683
Interest Rate
5.47%
Mortgage Type
FHA
Estimated Equity
$403,115
Purchase Details
Closed on
Apr 22, 2009
Sold by
Federal National Mortgage Association
Bought by
Emc Mortgage Corporation
Purchase Details
Closed on
Nov 30, 2007
Sold by
Braggs Carl and Wells Fargo Bank Na
Bought by
Federal National Mortgage Association
Purchase Details
Closed on
Jun 11, 1996
Sold by
Assoc Finl
Bought by
Braggs Carl
Home Financials for this Owner
Home Financials are based on the most recent Mortgage that was taken out on this home.
Original Mortgage
$19,000
Interest Rate
8.21%
Create a Home Valuation Report for This Property
The Home Valuation Report is an in-depth analysis detailing your home's value as well as a comparison with similar homes in the area
Home Values in the Area
Average Home Value in this Area
Purchase History
| Date | Buyer | Sale Price | Title Company |
|---|---|---|---|
| Cruz Moises | $61,825 | Coastal Title Agency Inc | |
| Emc Mortgage Corporation | -- | Coastal Title Agency Inc | |
| Federal National Mortgage Association | -- | Land Title Svcs Of Nj Inc | |
| Braggs Carl | $20,750 | -- |
Source: Public Records
Mortgage History
| Date | Status | Borrower | Loan Amount |
|---|---|---|---|
| Open | Cruz Moises | $78,551 | |
| Previous Owner | Braggs Carl | $19,000 |
Source: Public Records
Tax History Compared to Growth
Tax History
| Year | Tax Paid | Tax Assessment Tax Assessment Total Assessment is a certain percentage of the fair market value that is determined by local assessors to be the total taxable value of land and additions on the property. | Land | Improvement |
|---|---|---|---|---|
| 2025 | $5,374 | $345,600 | $112,100 | $233,500 |
| 2024 | $5,306 | $339,700 | $101,300 | $238,400 |
| 2023 | $5,306 | $343,200 | $67,800 | $275,400 |
| 2022 | $4,027 | $304,600 | $45,200 | $259,400 |
| 2021 | $4,027 | $254,900 | $43,900 | $211,000 |
| 2020 | $3,604 | $228,800 | $41,800 | $187,000 |
| 2019 | $3,364 | $203,900 | $39,800 | $164,100 |
| 2018 | $3,119 | $175,000 | $38,000 | $137,000 |
| 2017 | $3,020 | $145,200 | $34,500 | $110,700 |
| 2016 | $2,824 | $131,700 | $34,500 | $97,200 |
| 2015 | $2,792 | $126,100 | $31,400 | $94,700 |
| 2014 | $2,609 | $120,400 | $26,400 | $94,000 |
Source: Public Records
Map
Nearby Homes
- 128 Dewitt Ave
- 126 Dewitt Ave
- 135-137 Dewitt Ave
- 141 Elizabeth Ave
- 119 Ridge Ave
- 1405 Mattison Ave
- 5 Ivy Place
- 405 Myrtle Ave
- 0 Bangs Ave
- 1604 Bangs Ave
- 270 Fisher Ave
- 264 Fisher Ave
- 401 Ridge Ave
- 1235 Washington Ave
- 1711 Stratford Ave
- 303 Comstock St
- 1702 Summerfield Ave
- 1704 Summerfield Ave
- 1601 Heck Ave
- 1205 Washington Ave
- 116 Dewitt Ave
- 110 Dewitt Ave
- 116 De Witt Ave
- 108 Dewitt Ave
- 118 Dewitt Ave
- 117 Borden Ave
- 1321 Springwood Ave Unit B
- 1321 Springwood Ave Unit E
- 123 Borden Ave
- 123 Borden Ave Unit 2
- 125 Borden Ave
- 1401 Springwood Ave
- 1405 Springwood Ave
- 132 Dewitt Ave
- 129 Borden Ave Unit 131
- 206 Borden Ave
- 138 Borden Ave
- 1409 Springwood Ave
- 129 Dewitt Ave