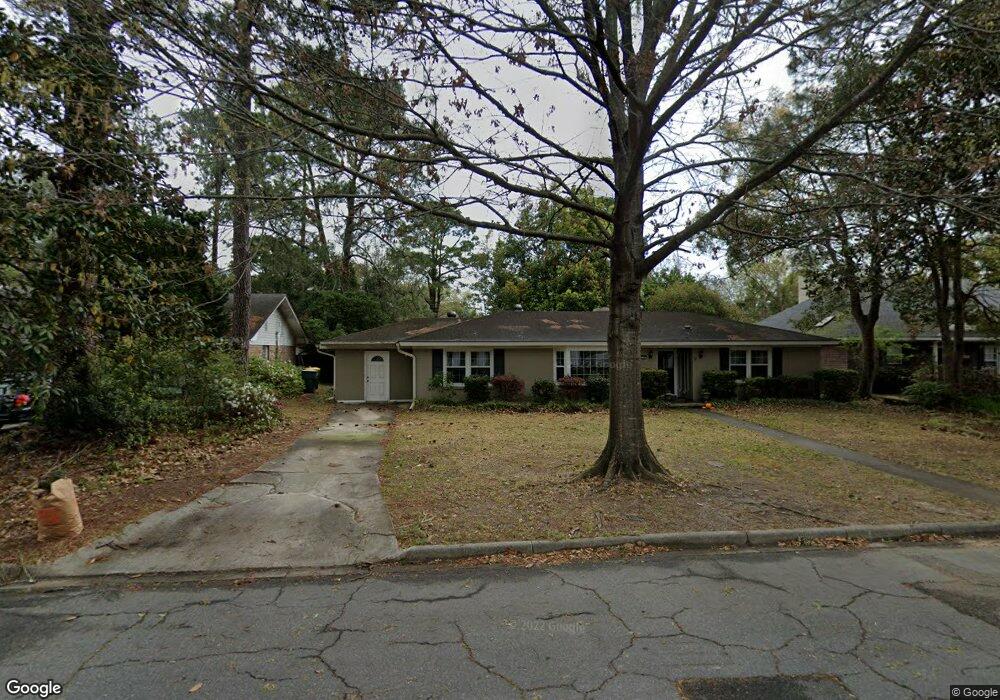
114 E 57th St Savannah, GA 31405
Ardmore-Gould Estates-Olin Heights NeighborhoodEstimated Value: $487,860 - $591,000
4
Beds
2
Baths
1,855
Sq Ft
$295/Sq Ft
Est. Value
About This Home
This home is located at 114 E 57th St, Savannah, GA 31405 and is currently estimated at $547,965, approximately $295 per square foot. 114 E 57th St is a home located in Chatham County with nearby schools including Jacob G. Smith Elementary School, Myers Middle School, and Beach High School.
Ownership History
Date
Name
Owned For
Owner Type
Purchase Details
Closed on
Apr 8, 2025
Sold by
Gonet Brian H
Bought by
Sappington Julie B and Gonet Brian H
Current Estimated Value
Purchase Details
Closed on
Dec 5, 2011
Bought by
Gonet Brian H
Purchase Details
Closed on
Sep 21, 2005
Sold by
Not Provided
Bought by
Spencer Benjamin U
Create a Home Valuation Report for This Property
The Home Valuation Report is an in-depth analysis detailing your home's value as well as a comparison with similar homes in the area
Home Values in the Area
Average Home Value in this Area
Purchase History
| Date | Buyer | Sale Price | Title Company |
|---|---|---|---|
| Sappington Julie B | -- | -- | |
| Gonet Brian H | $170,000 | -- | |
| Gonet Brian H | $170,000 | -- | |
| Spencer Benjamin U | $285,000 | -- |
Source: Public Records
Tax History Compared to Growth
Tax History
| Year | Tax Paid | Tax Assessment Tax Assessment Total Assessment is a certain percentage of the fair market value that is determined by local assessors to be the total taxable value of land and additions on the property. | Land | Improvement |
|---|---|---|---|---|
| 2025 | $2,979 | $166,360 | $44,000 | $122,360 |
| 2024 | $2,979 | $158,760 | $44,000 | $114,760 |
| 2023 | $1,059 | $129,280 | $30,000 | $99,280 |
| 2022 | $1,113 | $119,480 | $30,000 | $89,480 |
| 2021 | $4,012 | $109,000 | $30,000 | $79,000 |
| 2020 | $2,780 | $108,640 | $30,000 | $78,640 |
| 2019 | $4,009 | $104,080 | $30,000 | $74,080 |
| 2018 | $2,746 | $96,160 | $30,000 | $66,160 |
| 2017 | $2,693 | $91,840 | $27,040 | $64,800 |
| 2016 | $2,568 | $88,040 | $27,040 | $61,000 |
| 2015 | $3,718 | $89,160 | $27,120 | $62,040 |
| 2014 | $5,373 | $96,840 | $0 | $0 |
Source: Public Records
Map
Nearby Homes