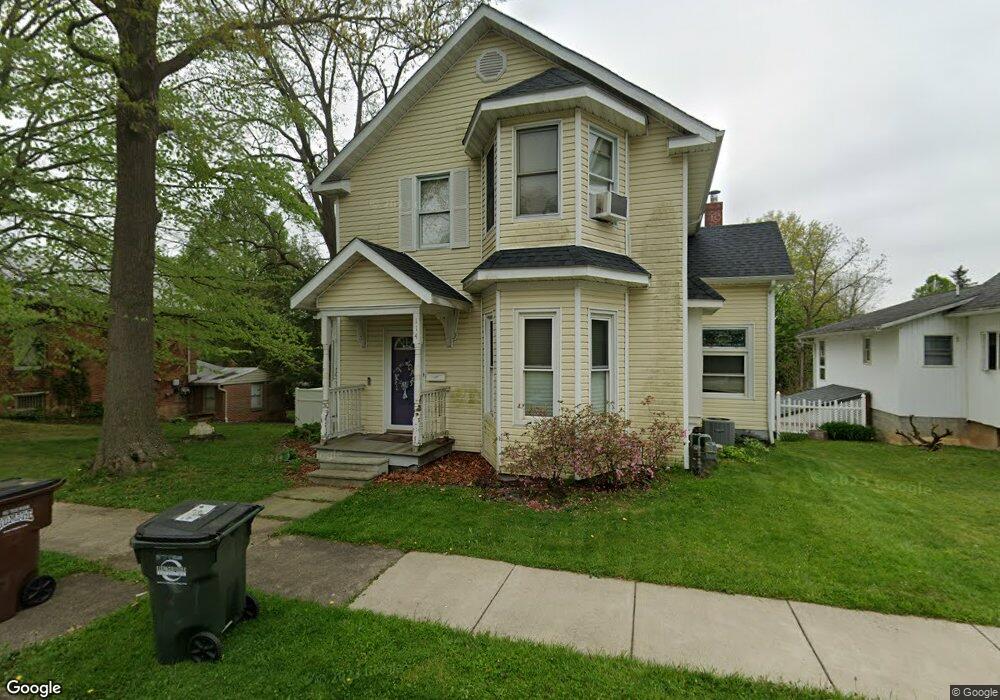
114 E Burgess St Mount Vernon, OH 43050
Estimated Value: $232,000 - $258,000
2
Beds
2
Baths
1,781
Sq Ft
$138/Sq Ft
Est. Value
About This Home
This home is located at 114 E Burgess St, Mount Vernon, OH 43050 and is currently estimated at $246,412, approximately $138 per square foot. 114 E Burgess St is a home located in Knox County with nearby schools including Mount Vernon High School, St. Vincent de Paul School, and Christian Star Academy.
Ownership History
Date
Name
Owned For
Owner Type
Purchase Details
Closed on
Nov 5, 2007
Sold by
Uzelac Elizabet B
Bought by
Shull Morgan J
Current Estimated Value
Home Financials for this Owner
Home Financials are based on the most recent Mortgage that was taken out on this home.
Original Mortgage
$92,500
Outstanding Balance
$58,526
Interest Rate
6.38%
Mortgage Type
New Conventional
Estimated Equity
$187,886
Purchase Details
Closed on
Jan 5, 2006
Sold by
Dailey Shawn L and Dailey Amy K
Bought by
Uzelac Elizabeth B
Home Financials for this Owner
Home Financials are based on the most recent Mortgage that was taken out on this home.
Original Mortgage
$83,600
Interest Rate
6.42%
Mortgage Type
New Conventional
Purchase Details
Closed on
Oct 23, 2000
Sold by
Harding Sonna L and Harding Marc S
Bought by
Dailey Shawn L and Dailey Amy K
Purchase Details
Closed on
Feb 7, 1994
Sold by
Banning Robert K and Banning Rosema
Bought by
Harding Sonna L and Harding Marc S
Create a Home Valuation Report for This Property
The Home Valuation Report is an in-depth analysis detailing your home's value as well as a comparison with similar homes in the area
Home Values in the Area
Average Home Value in this Area
Purchase History
| Date | Buyer | Sale Price | Title Company |
|---|---|---|---|
| Shull Morgan J | $69,375 | None Available | |
| Uzelac Elizabeth B | $78,375 | None Available | |
| Dailey Shawn L | $61,800 | -- | |
| Harding Sonna L | $43,600 | -- |
Source: Public Records
Mortgage History
| Date | Status | Borrower | Loan Amount |
|---|---|---|---|
| Open | Shull Morgan J | $92,500 | |
| Previous Owner | Uzelac Elizabeth B | $83,600 |
Source: Public Records
Tax History Compared to Growth
Tax History
| Year | Tax Paid | Tax Assessment Tax Assessment Total Assessment is a certain percentage of the fair market value that is determined by local assessors to be the total taxable value of land and additions on the property. | Land | Improvement |
|---|---|---|---|---|
| 2024 | $2,047 | $52,890 | $10,660 | $42,230 |
| 2023 | $2,049 | $52,890 | $10,660 | $42,230 |
| 2022 | $1,760 | $41,320 | $8,330 | $32,990 |
| 2021 | $1,760 | $41,320 | $8,330 | $32,990 |
| 2020 | $1,714 | $41,320 | $8,330 | $32,990 |
| 2019 | $1,628 | $36,570 | $10,540 | $26,030 |
| 2018 | $1,628 | $36,570 | $10,540 | $26,030 |
| 2017 | $1,600 | $36,570 | $10,540 | $26,030 |
| 2016 | $1,266 | $28,970 | $9,750 | $19,220 |
| 2015 | $1,271 | $28,970 | $9,750 | $19,220 |
| 2014 | $1,278 | $28,970 | $9,750 | $19,220 |
| 2013 | $1,350 | $29,130 | $9,170 | $19,960 |
Source: Public Records
Map
Nearby Homes
- 116 E Burgess St
- 110 E Burgess St
- 118 E Burgess St
- 113.5 E Burgess St
- 205 N Mckenzie St
- 115 E HamtraMcK St
- 113 1/2 E Burgess St
- 113 E HamtraMcK St
- 115 E Burgess St
- 113 E Burgess St
- 113 E Burgess St Unit 1/2
- 117 E Burgess St
- 111 E Burgess St
- 117 E HamtraMcK St
- 111 E HamtraMcK St
- 108 E Burgess St
- 119 E Burgess St
- 119 E HamtraMcK St
- 109 E Burgess St
- 204 N Mckenzie St