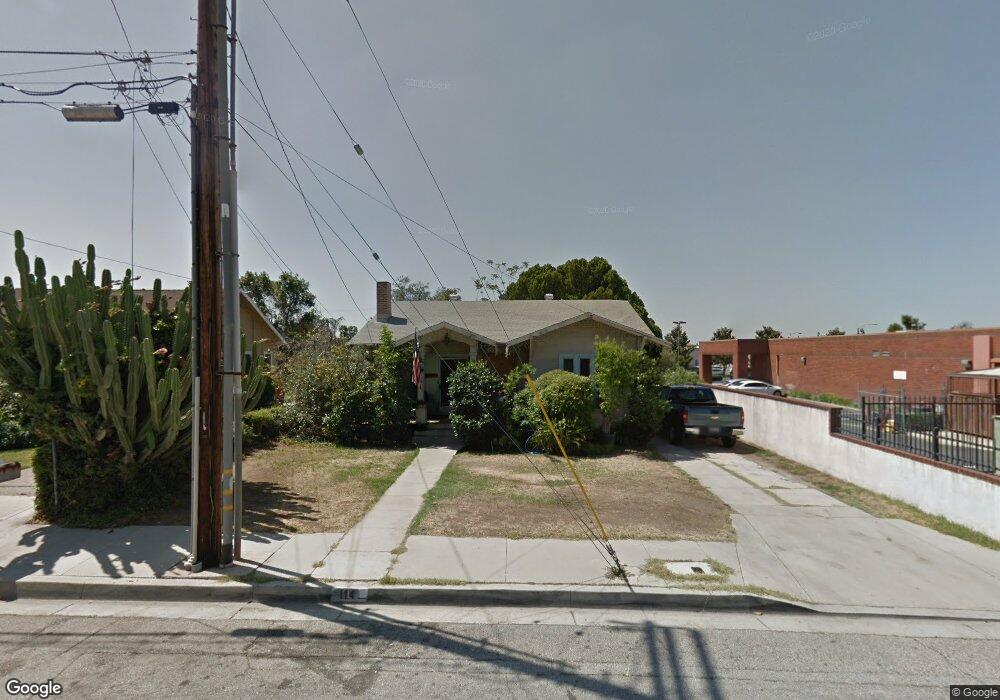
114 E Cherry Ave Monrovia, CA 91016
Estimated Value: $724,000 - $785,000
2
Beds
1
Bath
944
Sq Ft
$809/Sq Ft
Est. Value
About This Home
This home is located at 114 E Cherry Ave, Monrovia, CA 91016 and is currently estimated at $763,535, approximately $808 per square foot. 114 E Cherry Ave is a home located in Los Angeles County with nearby schools including Mayflower Elementary School, Santa Fe Computer Science Magnet, and Monrovia High School.
Ownership History
Date
Name
Owned For
Owner Type
Purchase Details
Closed on
Jun 3, 2025
Sold by
Victor Guardado Revocable Trust and Guardado Robert
Bought by
Guardado Valerie Ann
Current Estimated Value
Purchase Details
Closed on
Feb 10, 2021
Sold by
Guardado Victor
Bought by
Victor Guardado Revocable Trust and Guardado
Purchase Details
Closed on
May 27, 2020
Sold by
Guardado Robert A and Guardado Victor
Bought by
Guardado Victor
Home Financials for this Owner
Home Financials are based on the most recent Mortgage that was taken out on this home.
Original Mortgage
$780,000
Interest Rate
3.09%
Mortgage Type
Reverse Mortgage Home Equity Conversion Mortgage
Purchase Details
Closed on
May 4, 1995
Sold by
Guardado Lola
Bought by
Guardado Lola Romero and The Guardado Family Trust
Create a Home Valuation Report for This Property
The Home Valuation Report is an in-depth analysis detailing your home's value as well as a comparison with similar homes in the area
Home Values in the Area
Average Home Value in this Area
Purchase History
| Date | Buyer | Sale Price | Title Company |
|---|---|---|---|
| Guardado Valerie Ann | -- | None Listed On Document | |
| Victor Guardado Revocable Trust | -- | None Listed On Document | |
| Guardado Victor | -- | Chicago Title Company | |
| Guardado Lola Romero | -- | -- |
Source: Public Records
Mortgage History
| Date | Status | Borrower | Loan Amount |
|---|---|---|---|
| Previous Owner | Guardado Victor | $780,000 |
Source: Public Records
Tax History
| Year | Tax Paid | Tax Assessment Tax Assessment Total Assessment is a certain percentage of the fair market value that is determined by local assessors to be the total taxable value of land and additions on the property. | Land | Improvement |
|---|---|---|---|---|
| 2025 | $7,832 | $579,627 | $360,900 | $218,727 |
| 2024 | $7,832 | $568,263 | $353,824 | $214,439 |
| 2023 | $7,652 | $557,122 | $346,887 | $210,235 |
| 2022 | $7,430 | $546,199 | $340,086 | $206,113 |
| 2021 | $7,287 | $535,490 | $333,418 | $202,072 |
| 2020 | $700 | $21,691 | $7,599 | $14,092 |
| 2019 | $691 | $21,266 | $7,450 | $13,816 |
| 2018 | $624 | $20,850 | $7,304 | $13,546 |
| 2016 | $593 | $20,042 | $7,021 | $13,021 |
| 2015 | $583 | $19,742 | $6,916 | $12,826 |
| 2014 | $587 | $19,356 | $6,781 | $12,575 |
Source: Public Records
Map
Nearby Homes
- 128 Los Angeles Ave
- 148 W Cherry Ave
- 1406 S California Ave Unit D
- 231 E Walnut Ave
- 418 E Olive Ave
- 331 Genoa St Unit E
- 1218 S Mayflower Ave Unit B
- 709 S Magnolia Ave
- 151 E El Norte St
- 526 E Olive Ave Unit A
- 511 W Maple Ave
- 244 E Lime Ave
- 537 Diamond St
- 210 W Lime Ave
- 347 W Lemon Ave
- 520 E Lime Ave
- 2075 Flagstone Ave
- 2032 Graydon Ave
- 1020 S Mountain Ave Unit 24
- 938 Huntington Dr Unit K
- 118 E Cherry Ave
- 122 E Cherry Ave
- 113 Los Angeles Ave
- 115 Los Angeles Ave
- 126 E Cherry Ave
- 121 Los Angeles Ave
- 113 E Cherry Ave
- 119 E Cherry Ave
- 130 E Cherry Ave
- 121 E Cherry Ave
- 125 Los Angeles Ave
- 125 E Cherry Ave
- 129 Los Angeles Ave
- 134 E Cherry Ave
- 129 E Cherry Ave
- 1206 S Myrtle Ave
- 135 Los Angeles Ave
- 133 E Cherry Ave
- 136 E Cherry Ave
- 1310 S Myrtle Ave
Your Personal Tour Guide
Ask me questions while you tour the home.