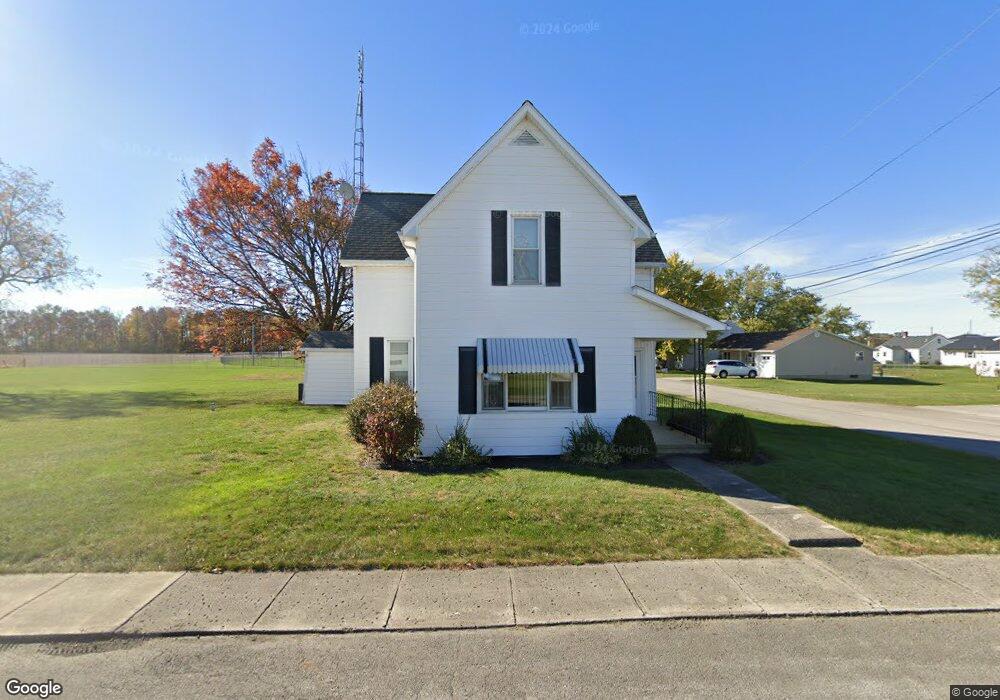
114 Elm St Osgood, OH 45351
Estimated Value: $198,000 - $266,000
4
Beds
2
Baths
1,528
Sq Ft
$145/Sq Ft
Est. Value
About This Home
This home is located at 114 Elm St, Osgood, OH 45351 and is currently estimated at $222,184, approximately $145 per square foot. 114 Elm St is a home with nearby schools including Marion Local Elementary School and Marion Local High School.
Ownership History
Date
Name
Owned For
Owner Type
Purchase Details
Closed on
Jul 1, 2022
Sold by
Pierron Mary A
Bought by
Pierron Brandon D
Current Estimated Value
Home Financials for this Owner
Home Financials are based on the most recent Mortgage that was taken out on this home.
Original Mortgage
$157,500
Interest Rate
5.1%
Mortgage Type
New Conventional
Purchase Details
Closed on
Dec 15, 2009
Sold by
Estate Of Joseph L Pierron
Bought by
Pierron Mary A
Purchase Details
Closed on
Dec 14, 2007
Sold by
Pierron Joseph L and Pierron Mary A
Bought by
Pierron Joseph L and Pierron Mary A
Create a Home Valuation Report for This Property
The Home Valuation Report is an in-depth analysis detailing your home's value as well as a comparison with similar homes in the area
Home Values in the Area
Average Home Value in this Area
Purchase History
| Date | Buyer | Sale Price | Title Company |
|---|---|---|---|
| Pierron Brandon D | $175,000 | Guillozet Thomas L | |
| Pierron Brandon D | $175,000 | None Listed On Document | |
| Pierron Mary A | -- | None Available | |
| Pierron Joseph L | -- | Attorney |
Source: Public Records
Mortgage History
| Date | Status | Borrower | Loan Amount |
|---|---|---|---|
| Previous Owner | Pierron Brandon D | $157,500 |
Source: Public Records
Tax History Compared to Growth
Tax History
| Year | Tax Paid | Tax Assessment Tax Assessment Total Assessment is a certain percentage of the fair market value that is determined by local assessors to be the total taxable value of land and additions on the property. | Land | Improvement |
|---|---|---|---|---|
| 2024 | $2,108 | $56,420 | $8,250 | $48,170 |
| 2023 | $2,109 | $56,420 | $8,250 | $48,170 |
| 2022 | $933 | $33,660 | $7,010 | $26,650 |
| 2021 | $950 | $33,660 | $7,010 | $26,650 |
| 2020 | $953 | $33,660 | $7,010 | $26,650 |
| 2019 | $761 | $28,330 | $7,010 | $21,320 |
| 2018 | $794 | $28,330 | $7,010 | $21,320 |
| 2017 | $659 | $28,330 | $7,010 | $21,320 |
| 2016 | $650 | $25,080 | $7,010 | $18,070 |
| 2015 | $650 | $25,080 | $7,010 | $18,070 |
| 2014 | $651 | $25,080 | $7,010 | $18,070 |
| 2013 | $657 | $23,440 | $7,010 | $16,430 |
Source: Public Records
Map
Nearby Homes