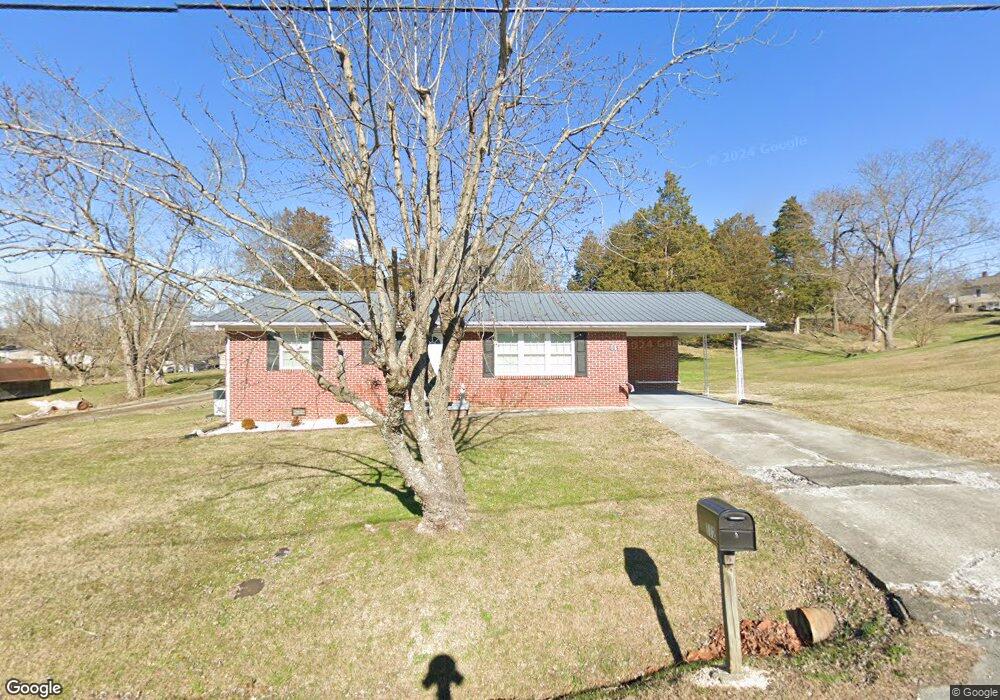
114 Elmwood Ave Bulls Gap, TN 37711
Estimated Value: $235,000 - $284,403
3
Beds
2
Baths
1,512
Sq Ft
$174/Sq Ft
Est. Value
About This Home
This home is located at 114 Elmwood Ave, Bulls Gap, TN 37711 and is currently estimated at $263,601, approximately $174 per square foot. 114 Elmwood Ave is a home located in Hawkins County with nearby schools including Bulls Gap School and Cherokee High School.
Ownership History
Date
Name
Owned For
Owner Type
Purchase Details
Closed on
Sep 17, 2020
Sold by
Campbell J A
Bought by
Laing Erika M and Laing Westin J
Current Estimated Value
Home Financials for this Owner
Home Financials are based on the most recent Mortgage that was taken out on this home.
Original Mortgage
$155,700
Outstanding Balance
$137,917
Interest Rate
2.8%
Mortgage Type
New Conventional
Estimated Equity
$125,684
Purchase Details
Closed on
Oct 10, 1972
Bought by
Campbell Campbell J and Campbell Deanna
Create a Home Valuation Report for This Property
The Home Valuation Report is an in-depth analysis detailing your home's value as well as a comparison with similar homes in the area
Home Values in the Area
Average Home Value in this Area
Purchase History
| Date | Buyer | Sale Price | Title Company |
|---|---|---|---|
| Laing Erika M | $165,700 | Blue Ridge Title Company Llc | |
| Campbell Campbell J | -- | -- |
Source: Public Records
Mortgage History
| Date | Status | Borrower | Loan Amount |
|---|---|---|---|
| Open | Laing Erika M | $155,700 |
Source: Public Records
Tax History Compared to Growth
Tax History
| Year | Tax Paid | Tax Assessment Tax Assessment Total Assessment is a certain percentage of the fair market value that is determined by local assessors to be the total taxable value of land and additions on the property. | Land | Improvement |
|---|---|---|---|---|
| 2024 | $1,134 | $44,400 | $2,625 | $41,775 |
| 2023 | $1,032 | $44,400 | $0 | $0 |
| 2022 | $1,322 | $44,400 | $2,625 | $41,775 |
| 2021 | $1,253 | $44,400 | $2,625 | $41,775 |
| 2020 | $972 | $44,400 | $2,625 | $41,775 |
| 2019 | $972 | $29,875 | $2,425 | $27,450 |
| 2018 | $966 | $29,875 | $2,425 | $27,450 |
| 2017 | $966 | $29,875 | $2,425 | $27,450 |
| 2016 | $960 | $29,875 | $2,425 | $27,450 |
| 2015 | $940 | $29,875 | $2,425 | $27,450 |
| 2014 | $1,026 | $32,825 | $2,425 | $30,400 |
Source: Public Records
Map
Nearby Homes
- 123 N Main St
- 116 Magnolia Ave
- 2.79 Ac U S 11e
- 350 N Vfw Rd
- 202 S Shepherd Dr
- 711 N Main St
- 0 Whitehorn Rd Unit 1314385
- 438 N Vfw Rd
- 473 Lautner Rd
- 415 Stone Mountain Rd
- Tbd Stone Mountain Rd
- 15 Stone Mountain Rd
- 7 W Andrew Johnson Hwy
- 945 N Main St
- 204 Meadowview Rd
- 670 Bulls Gap Saint Clair Rd
- 670 Bulls Gap-Saint Clair Rd
- 330 Oasis Rd
- 0 Guthries Gap Rd Unit 611585
- 231 Guthries Gap Rd
- 112 Elmwood Ave
- 108 Elmwood Ave
- 201 N Main St
- 117 N Main St
- 118 Elmwood Ave
- 120 Elmwood Ave
- 113 N Main St
- 218 Massengill Ave
- 207 N Main St
- 115 Elmwood Ave
- 216 Massengill Ave
- 114 N Main St
- 222 Massengill Ave
- 000 Elmwood Ave Unit 1
- 200 N Main St
- 119 Elmwood Ave
- 208 N Main St
- 213 N Main St
- 107 Quillen Ave
- 214 Massengill Ave