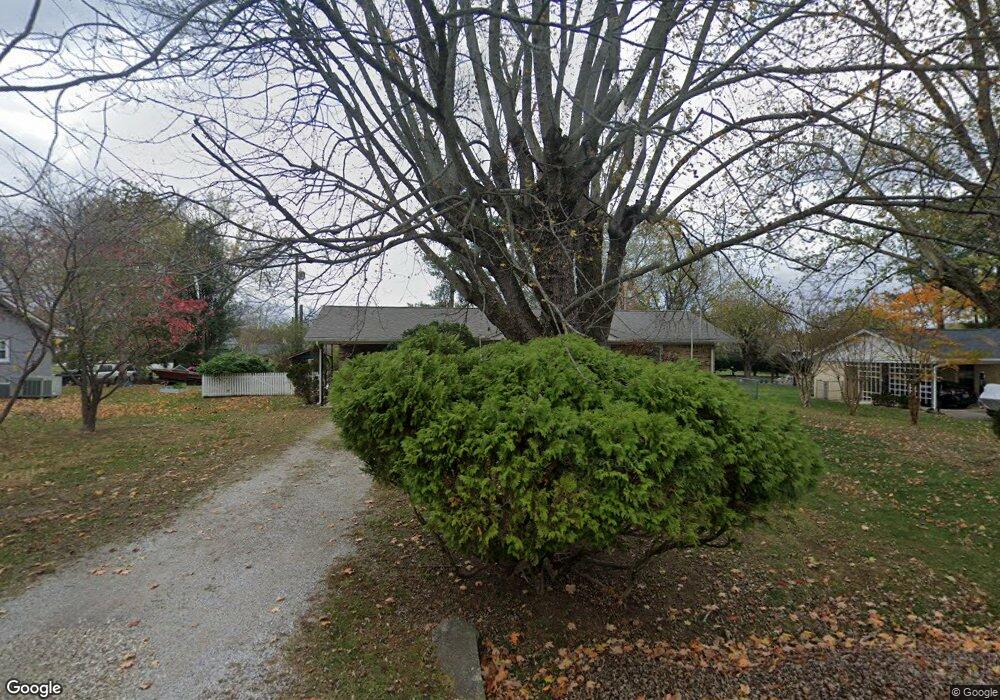
114 Gresham Dr Cookeville, TN 38506
Estimated Value: $214,066 - $308,000
Studio
2
Baths
1,546
Sq Ft
$177/Sq Ft
Est. Value
About This Home
This home is located at 114 Gresham Dr, Cookeville, TN 38506 and is currently estimated at $273,517, approximately $176 per square foot. 114 Gresham Dr is a home located in Putnam County with nearby schools including Algood Elementary School, Algood Middle School, and Cookeville High School.
Ownership History
Date
Name
Owned For
Owner Type
Purchase Details
Closed on
May 17, 2007
Sold by
Steward Clinton T
Bought by
Danny Martin
Current Estimated Value
Purchase Details
Closed on
Apr 29, 1998
Sold by
Monroe Drexler Robert
Bought by
Chafin William R and Chafin Frances
Home Financials for this Owner
Home Financials are based on the most recent Mortgage that was taken out on this home.
Original Mortgage
$77,900
Interest Rate
7.03%
Purchase Details
Closed on
Sep 24, 1992
Bought by
Drexler Robert Monroe
Purchase Details
Closed on
Nov 3, 1986
Bought by
Bunting Richard L
Create a Home Valuation Report for This Property
The Home Valuation Report is an in-depth analysis detailing your home's value as well as a comparison with similar homes in the area
Home Values in the Area
Average Home Value in this Area
Purchase History
| Date | Buyer | Sale Price | Title Company |
|---|---|---|---|
| Danny Martin | -- | -- | |
| Chafin William R | $82,000 | -- | |
| Drexler Robert Monroe | $59,000 | -- | |
| Bunting Richard L | $47,900 | -- |
Source: Public Records
Mortgage History
| Date | Status | Borrower | Loan Amount |
|---|---|---|---|
| Previous Owner | Bunting Richard L | $77,900 |
Source: Public Records
Tax History
| Year | Tax Paid | Tax Assessment Tax Assessment Total Assessment is a certain percentage of the fair market value that is determined by local assessors to be the total taxable value of land and additions on the property. | Land | Improvement |
|---|---|---|---|---|
| 2025 | -- | $32,975 | $3,750 | $29,225 |
| 2024 | -- | $32,975 | $3,750 | $29,225 |
| 2023 | $877 | $32,975 | $3,750 | $29,225 |
| 2022 | $815 | $32,975 | $3,750 | $29,225 |
| 2021 | $935 | $32,975 | $3,750 | $29,225 |
| 2020 | $681 | $32,975 | $3,750 | $29,225 |
| 2019 | $784 | $23,275 | $3,750 | $19,525 |
| 2018 | $749 | $23,275 | $3,750 | $19,525 |
| 2017 | $749 | $23,275 | $3,750 | $19,525 |
| 2016 | $754 | $23,275 | $3,750 | $19,525 |
| 2015 | $772 | $23,275 | $3,750 | $19,525 |
| 2014 | $744 | $22,429 | $0 | $0 |
Source: Public Records
Map
Nearby Homes
- 242 Dry Valley Rd
- LOT 21 Williams Cir
- 0 Williams Cir
- 360 Avey Cir
- 146 Dry Valley Rd
- 251 Haven Ln
- 317 Taylor Cir
- 164 W Wall St
- 1700 Fairway Dr
- 2835 Deck Mountain Rd
- 1623 Bobby Nichols Dr
- 1805 Birdie Ct
- 0 Burton Cove Rd
- 3433 Middleford Dr
- 3480 Plantation Dr
- 188 2nd Ave N
- 2296 Nicholas Ave
- 2291 Lopez Ct
- 2394 Mountain Reserve Dr
- 2289 Lopez Ct
Your Personal Tour Guide
Ask me questions while you tour the home.