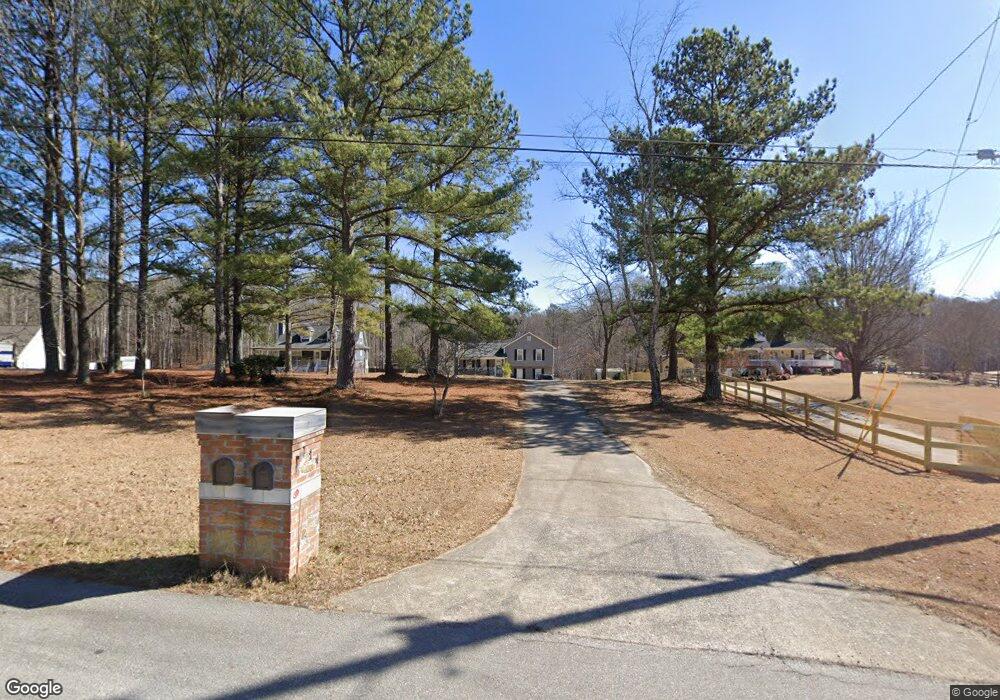
114 Hudson Cir Unit 5 Douglasville, GA 30134
Estimated Value: $268,000 - $337,000
3
Beds
2
Baths
1,220
Sq Ft
$246/Sq Ft
Est. Value
About This Home
This home is located at 114 Hudson Cir Unit 5, Douglasville, GA 30134 and is currently estimated at $300,234, approximately $246 per square foot. 114 Hudson Cir Unit 5 is a home located in Paulding County with nearby schools including Connie Dugan Elementary School, Irma C. Austin Middle School, and South Paulding High School.
Ownership History
Date
Name
Owned For
Owner Type
Purchase Details
Closed on
May 25, 2011
Sold by
Hud-Housing Of Urban Dev
Bought by
Gienapp Gary
Current Estimated Value
Home Financials for this Owner
Home Financials are based on the most recent Mortgage that was taken out on this home.
Original Mortgage
$50,954
Outstanding Balance
$36,008
Interest Rate
5.25%
Mortgage Type
FHA
Estimated Equity
$264,226
Purchase Details
Closed on
Oct 5, 2010
Sold by
Wells Fargo Bk Na
Bought by
Hud-Housing Of Urban Dev
Purchase Details
Closed on
Jan 2, 2004
Sold by
Morris Eric & Bethany S
Bought by
Gable Dan A
Home Financials for this Owner
Home Financials are based on the most recent Mortgage that was taken out on this home.
Original Mortgage
$127,006
Interest Rate
5.87%
Mortgage Type
FHA
Create a Home Valuation Report for This Property
The Home Valuation Report is an in-depth analysis detailing your home's value as well as a comparison with similar homes in the area
Home Values in the Area
Average Home Value in this Area
Purchase History
| Date | Buyer | Sale Price | Title Company |
|---|---|---|---|
| Gienapp Gary | -- | -- | |
| Hud-Housing Of Urban Dev | -- | -- | |
| Wells Fargo Bk Na | $131,337 | -- | |
| Gable Dan A | $129,000 | -- |
Source: Public Records
Mortgage History
| Date | Status | Borrower | Loan Amount |
|---|---|---|---|
| Open | Gienapp Gary | $50,954 | |
| Previous Owner | Gable Dan A | $127,006 |
Source: Public Records
Tax History Compared to Growth
Tax History
| Year | Tax Paid | Tax Assessment Tax Assessment Total Assessment is a certain percentage of the fair market value that is determined by local assessors to be the total taxable value of land and additions on the property. | Land | Improvement |
|---|---|---|---|---|
| 2024 | $2,635 | $105,944 | $12,000 | $93,944 |
| 2023 | $2,642 | $101,360 | $12,000 | $89,360 |
| 2022 | $3,081 | $103,732 | $12,000 | $91,732 |
| 2021 | $2,540 | $85,520 | $12,000 | $73,520 |
| 2020 | $1,915 | $64,484 | $12,000 | $52,484 |
| 2019 | $1,720 | $57,088 | $12,000 | $45,088 |
| 2018 | $834 | $47,032 | $16,000 | $31,032 |
| 2017 | $1,056 | $56,708 | $16,000 | $40,708 |
| 2016 | $964 | $53,088 | $16,000 | $37,088 |
| 2015 | $803 | $44,376 | $16,000 | $28,376 |
| 2014 | $1,253 | $41,544 | $16,000 | $25,544 |
| 2013 | -- | $30,960 | $16,000 | $14,960 |
Source: Public Records
Map
Nearby Homes
- 114 Hudson Cir
- 134 Hudson Cir
- 106 Hudson Cir
- 150 Hudson Cir
- 172 Hudson Cir
- 90 Hudson Cir
- 180 Hudson Cir
- 69 Hudson Cir
- 59 Hudson Cir
- 23 Elberta Terrace
- 23 Elberta Terrace Unit 23
- 23 Elberta Terrace
- 393 Halehaven Dr
- 212 Hudson Cir
- 20 Hudson Cir
- 23 Elberta Terrace
- 379 Halehaven Dr
- 405 Halehaven Dr Unit 4
- 28 Elberta Terrace Unit 4
- 34 Fortuna Ct