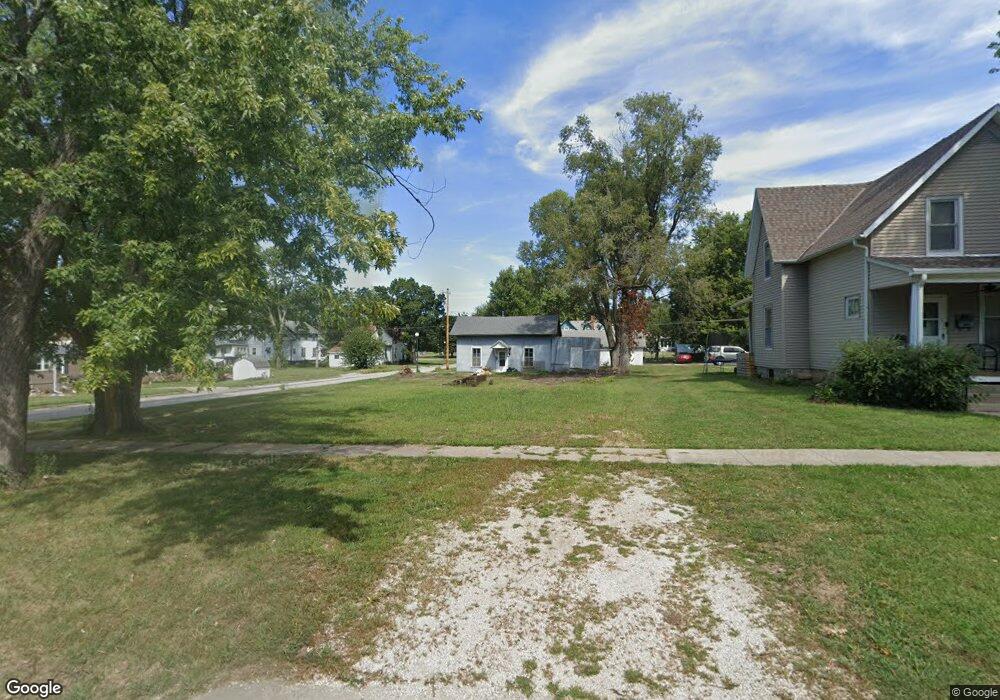
114 Kickapoo St Hiawatha, KS 66434
Estimated Value: $43,659 - $96,000
1
Bed
1
Bath
480
Sq Ft
$144/Sq Ft
Est. Value
About This Home
This home is located at 114 Kickapoo St, Hiawatha, KS 66434 and is currently estimated at $69,165, approximately $144 per square foot. 114 Kickapoo St is a home located in Brown County with nearby schools including Hiawatha Elementary School, Hiawatha Middle School, and Hiawatha Senior High School.
Ownership History
Date
Name
Owned For
Owner Type
Purchase Details
Closed on
Mar 26, 2025
Sold by
Old Cedar Properties Llc
Bought by
Meiners Richard M
Current Estimated Value
Purchase Details
Closed on
Jun 9, 2023
Sold by
Brassfield Jeffrey and Brassfield Melissa
Bought by
Jcm Midwest Llc
Purchase Details
Closed on
Sep 30, 2008
Sold by
Wagner Patricia Ann and Wagner Patricia A
Bought by
Jcm Midwest Llc
Home Financials for this Owner
Home Financials are based on the most recent Mortgage that was taken out on this home.
Original Mortgage
$35,275
Interest Rate
6.1%
Mortgage Type
Future Advance Clause Open End Mortgage
Create a Home Valuation Report for This Property
The Home Valuation Report is an in-depth analysis detailing your home's value as well as a comparison with similar homes in the area
Home Values in the Area
Average Home Value in this Area
Purchase History
| Date | Buyer | Sale Price | Title Company |
|---|---|---|---|
| Meiners Richard M | -- | None Listed On Document | |
| Jcm Midwest Llc | -- | None Listed On Document | |
| Jcm Midwest Llc | -- | None Available |
Source: Public Records
Mortgage History
| Date | Status | Borrower | Loan Amount |
|---|---|---|---|
| Previous Owner | Jcm Midwest Llc | $35,275 |
Source: Public Records
Tax History
| Year | Tax Paid | Tax Assessment Tax Assessment Total Assessment is a certain percentage of the fair market value that is determined by local assessors to be the total taxable value of land and additions on the property. | Land | Improvement |
|---|---|---|---|---|
| 2025 | $92 | $1,570 | $1,113 | $457 |
| 2024 | $1 | $872 | $872 | $0 |
| 2023 | $450 | $4,140 | $711 | $3,429 |
| 2022 | $401 | $3,829 | $630 | $3,199 |
| 2021 | $611 | $5,030 | $628 | $4,402 |
| 2020 | $572 | $4,789 | $628 | $4,161 |
| 2019 | $578 | $4,561 | $558 | $4,003 |
| 2018 | $759 | $5,000 | $558 | $4,442 |
| 2017 | $759 | $5,602 | $558 | $5,044 |
| 2016 | $729 | $5,371 | $488 | $4,883 |
| 2015 | -- | $4,927 | $488 | $4,439 |
| 2014 | -- | $4,664 | $483 | $4,181 |
Source: Public Records
Map
Nearby Homes
Your Personal Tour Guide
Ask me questions while you tour the home.