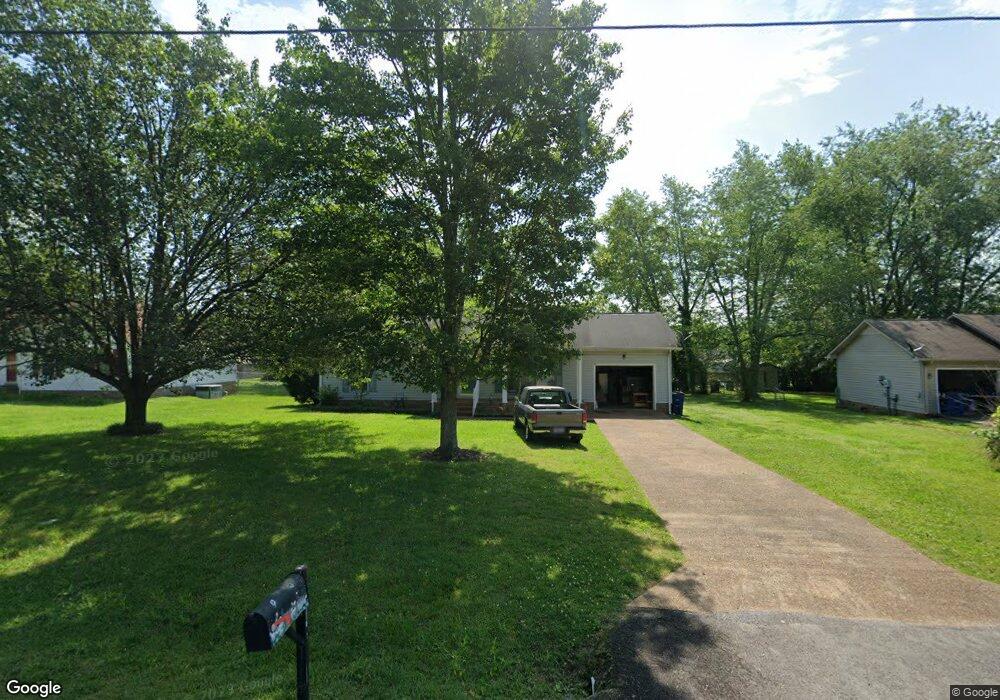
114 Lantern Ln Shelbyville, TN 37160
Estimated Value: $254,171 - $302,000
--
Bed
2
Baths
1,276
Sq Ft
$225/Sq Ft
Est. Value
About This Home
This home is located at 114 Lantern Ln, Shelbyville, TN 37160 and is currently estimated at $286,793, approximately $224 per square foot. 114 Lantern Ln is a home located in Bedford County with nearby schools including South Side Elementary School, Harris Middle School, and Christian Chapel Academy.
Ownership History
Date
Name
Owned For
Owner Type
Purchase Details
Closed on
Mar 6, 2007
Sold by
Wingate Brenda
Bought by
Solomon Brenda
Current Estimated Value
Purchase Details
Closed on
Jan 20, 2004
Sold by
Solomon Billy A
Bought by
Wingate Brenda
Purchase Details
Closed on
Apr 30, 1999
Sold by
Hoover Kimberly K
Bought by
Carey Kimberly J
Purchase Details
Closed on
Feb 20, 1990
Bought by
Hoover Kimberly K
Purchase Details
Closed on
Jan 29, 1990
Bought by
Hoover Kimberly K
Purchase Details
Closed on
Jan 11, 1989
Bought by
Flippo Belton R
Create a Home Valuation Report for This Property
The Home Valuation Report is an in-depth analysis detailing your home's value as well as a comparison with similar homes in the area
Home Values in the Area
Average Home Value in this Area
Purchase History
| Date | Buyer | Sale Price | Title Company |
|---|---|---|---|
| Solomon Brenda | -- | -- | |
| Wingate Brenda | $105,000 | -- | |
| Carey Kimberly J | -- | -- | |
| Hoover Kimberly K | $8,000 | -- | |
| Hoover Kimberly K | $11,000 | -- | |
| Flippo Belton R | -- | -- |
Source: Public Records
Tax History Compared to Growth
Tax History
| Year | Tax Paid | Tax Assessment Tax Assessment Total Assessment is a certain percentage of the fair market value that is determined by local assessors to be the total taxable value of land and additions on the property. | Land | Improvement |
|---|---|---|---|---|
| 2025 | -- | $36,200 | $0 | $0 |
| 2024 | -- | $36,200 | $7,250 | $28,950 |
| 2023 | $1,378 | $36,200 | $7,250 | $28,950 |
| 2022 | $1,418 | $36,200 | $7,250 | $28,950 |
| 2021 | $1,287 | $36,200 | $7,250 | $28,950 |
| 2020 | $1,113 | $36,200 | $7,250 | $28,950 |
| 2019 | $1,113 | $25,125 | $5,500 | $19,625 |
| 2018 | $1,088 | $25,125 | $5,500 | $19,625 |
| 2017 | $1,088 | $25,125 | $5,500 | $19,625 |
| 2016 | $1,078 | $25,125 | $5,500 | $19,625 |
| 2015 | $1,078 | $25,125 | $5,500 | $19,625 |
| 2014 | $940 | $23,971 | $0 | $0 |
Source: Public Records
Map
Nearby Homes