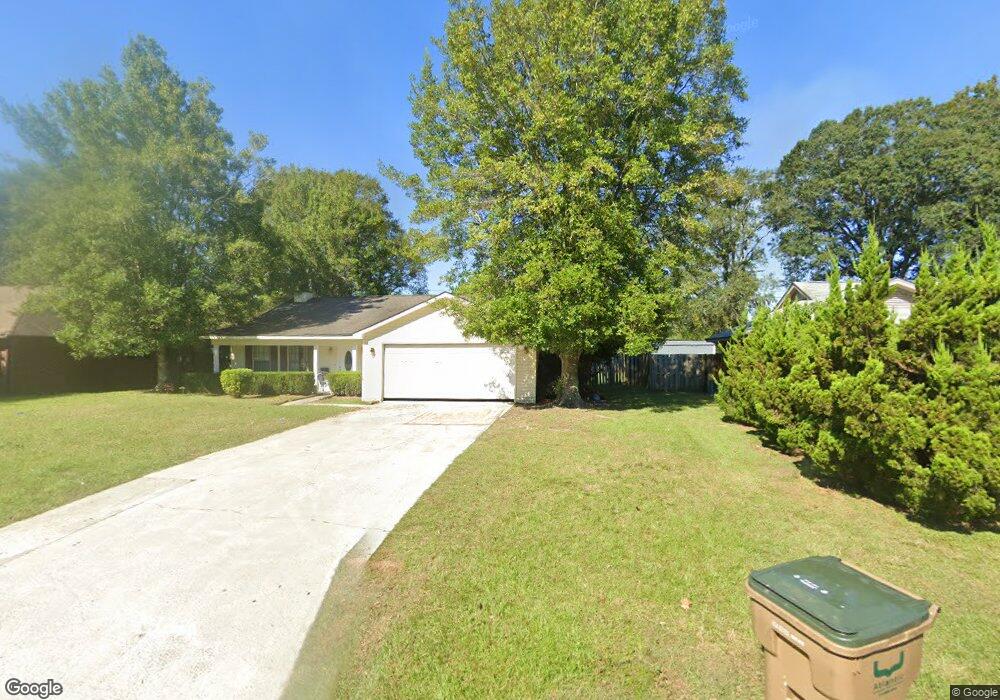
114 Longleaf Cir Pooler, GA 31322
Estimated Value: $238,000 - $253,000
3
Beds
2
Baths
1,145
Sq Ft
$213/Sq Ft
Est. Value
About This Home
This home is located at 114 Longleaf Cir, Pooler, GA 31322 and is currently estimated at $243,801, approximately $212 per square foot. 114 Longleaf Cir is a home located in Chatham County with nearby schools including West Chatham Elementary School, West Chatham Middle School, and New Hampstead High School.
Ownership History
Date
Name
Owned For
Owner Type
Purchase Details
Closed on
Aug 23, 2022
Sold by
Sass Ryan B
Bought by
Sass Rr Llc
Current Estimated Value
Home Financials for this Owner
Home Financials are based on the most recent Mortgage that was taken out on this home.
Original Mortgage
$115,000
Outstanding Balance
$109,606
Interest Rate
5.3%
Mortgage Type
New Conventional
Estimated Equity
$134,195
Purchase Details
Closed on
Apr 15, 2019
Sold by
Sass Rr Llc
Bought by
Sass Ryan B and Sass Ronald C
Purchase Details
Closed on
Dec 2, 2016
Sold by
Hud & Housing Of Urban Dev
Bought by
Sass Rr Llc
Purchase Details
Closed on
May 3, 2016
Bought by
Sec Of Housing & Urban D
Purchase Details
Closed on
Oct 30, 2006
Sold by
Not Provided
Bought by
Hubbard Kristina
Home Financials for this Owner
Home Financials are based on the most recent Mortgage that was taken out on this home.
Original Mortgage
$232,323
Interest Rate
6.27%
Mortgage Type
New Conventional
Create a Home Valuation Report for This Property
The Home Valuation Report is an in-depth analysis detailing your home's value as well as a comparison with similar homes in the area
Home Values in the Area
Average Home Value in this Area
Purchase History
| Date | Buyer | Sale Price | Title Company |
|---|---|---|---|
| Sass Rr Llc | -- | -- | |
| Sass Ryan B | -- | -- | |
| Sass Ryan B | -- | -- | |
| Sass Rr Llc | -- | -- | |
| Sass Ryan Bradley | $100,000 | -- | |
| Sec Of Housing & Urban D | $96,730 | -- | |
| Selene Finance Lp | $96,730 | -- | |
| Hubbard Kristina | -- | -- | |
| Hubbard Kristina | -- | -- |
Source: Public Records
Mortgage History
| Date | Status | Borrower | Loan Amount |
|---|---|---|---|
| Open | Sass Rr Llc | $115,000 | |
| Previous Owner | Hubbard Kristina | $232,323 | |
| Previous Owner | Hubbard Kristina | $131,138 |
Source: Public Records
Tax History
| Year | Tax Paid | Tax Assessment Tax Assessment Total Assessment is a certain percentage of the fair market value that is determined by local assessors to be the total taxable value of land and additions on the property. | Land | Improvement |
|---|---|---|---|---|
| 2025 | $4,876 | $75,520 | $18,000 | $57,520 |
| 2024 | $32 | $76,720 | $18,000 | $58,720 |
| 2023 | $3,225 | $71,560 | $18,000 | $53,560 |
| 2022 | $1,789 | $58,040 | $12,000 | $46,040 |
| 2021 | $1,753 | $52,200 | $12,000 | $40,200 |
| 2020 | $1,627 | $47,600 | $12,000 | $35,600 |
| 2019 | $1,627 | $47,600 | $12,000 | $35,600 |
| 2018 | $1,607 | $46,960 | $12,000 | $34,960 |
| 2017 | $1,281 | $40,000 | $7,680 | $32,320 |
| 2016 | $1,448 | $45,120 | $8,160 | $36,960 |
| 2015 | $1,491 | $46,240 | $8,160 | $38,080 |
| 2014 | $1,770 | $37,040 | $0 | $0 |
Source: Public Records
Map
Nearby Homes
- 22 Chamois Ct
- 104 Redfield Dr
- 221 Merganser Dr
- 119 Holloway Hill
- 126 Holloway Hill
- 167 Holloway Hill
- 248 Longleaf Cir
- 12 Woodford Reserve Dr
- 14 Woodford Reserve Dr
- 80 Woodford Reserve Dr
- 301 Merganser Dr
- 81 Woodford Reserve Dr
- 310 Merganser Dr
- 33 Woodford Reserve Dr
- 111 Ashwood Dr
- 110 Chime Creek Dr
- 121 Legends Rd
- 26 Coronado Ct
- 109 Pinebury Rd
- 107 Pinebury Rd
- 112 Longleaf Cir
- 116 Longleaf Cir
- 110 Longleaf Cir
- 118 Longleaf Cir
- 107 Longleaf Cir
- 105 Longleaf Cir
- 109 Longleaf Cir
- 114 Silverton Rd
- 116 Silverton Rd
- 103 Longleaf Cir
- 108 Longleaf Cir
- 112 Silverton Rd
- 120 Longleaf Cir
- 118 Silverton Rd
- 111 Longleaf Cir
- 110 Silverton Rd
- 122 Longleaf Cir
- 120 Silverton Rd
- 20 Chamois Ct
- 18 Chamois Ct
Your Personal Tour Guide
Ask me questions while you tour the home.