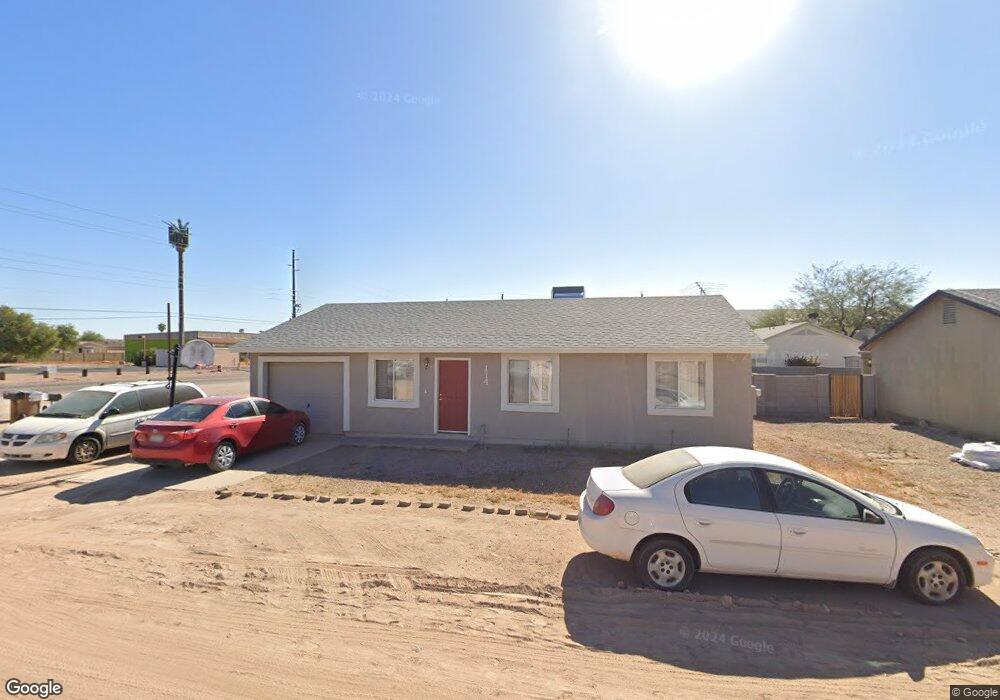
114 N Signal Butte Rd Apache Junction, AZ 85120
University Manor NeighborhoodEstimated Value: $291,108 - $352,000
3
Beds
2
Baths
1,114
Sq Ft
$297/Sq Ft
Est. Value
About This Home
This home is located at 114 N Signal Butte Rd, Apache Junction, AZ 85120 and is currently estimated at $331,027, approximately $297 per square foot. 114 N Signal Butte Rd is a home located in Maricopa County with nearby schools including Sousa Elementary School, Franklin at Brimhall Elementary School, and Franklin West Elementary School.
Ownership History
Date
Name
Owned For
Owner Type
Purchase Details
Closed on
Apr 23, 2018
Sold by
Hall Brian R and Hall Teresa L
Bought by
Clark John K and Clark Sharon G
Current Estimated Value
Home Financials for this Owner
Home Financials are based on the most recent Mortgage that was taken out on this home.
Original Mortgage
$130,756
Outstanding Balance
$112,448
Interest Rate
4.44%
Mortgage Type
New Conventional
Estimated Equity
$218,579
Purchase Details
Closed on
Oct 27, 1998
Sold by
Gurr Malan L and Gurr Deanna L
Bought by
Gurr Malan L and Gurr Deanna L
Home Financials for this Owner
Home Financials are based on the most recent Mortgage that was taken out on this home.
Original Mortgage
$49,350
Interest Rate
6.6%
Create a Home Valuation Report for This Property
The Home Valuation Report is an in-depth analysis detailing your home's value as well as a comparison with similar homes in the area
Home Values in the Area
Average Home Value in this Area
Purchase History
| Date | Buyer | Sale Price | Title Company |
|---|---|---|---|
| Clark John K | $134,800 | Empire West Title Agency Llc | |
| Gurr Malan L | -- | Chicago Title Insurance Co |
Source: Public Records
Mortgage History
| Date | Status | Borrower | Loan Amount |
|---|---|---|---|
| Open | Clark John K | $130,756 | |
| Previous Owner | Gurr Malan L | $49,350 |
Source: Public Records
Tax History Compared to Growth
Tax History
| Year | Tax Paid | Tax Assessment Tax Assessment Total Assessment is a certain percentage of the fair market value that is determined by local assessors to be the total taxable value of land and additions on the property. | Land | Improvement |
|---|---|---|---|---|
| 2025 | $660 | $8,861 | -- | -- |
| 2024 | $675 | $8,439 | -- | -- |
| 2023 | $675 | $22,930 | $4,580 | $18,350 |
| 2022 | $658 | $17,400 | $3,480 | $13,920 |
| 2021 | $665 | $14,820 | $2,960 | $11,860 |
| 2020 | $660 | $13,730 | $2,740 | $10,990 |
| 2019 | $605 | $11,830 | $2,360 | $9,470 |
| 2018 | $588 | $9,800 | $1,960 | $7,840 |
| 2017 | $681 | $8,770 | $1,750 | $7,020 |
| 2016 | $666 | $7,820 | $1,560 | $6,260 |
| 2015 | $623 | $6,770 | $1,350 | $5,420 |
Source: Public Records
Map
Nearby Homes
- 138 N Signal Butte Rd
- 315 N Keith St
- 10558 E Boise St
- 345 N Signal Butte Rd Unit 23
- 10936 E Apache Trail Unit 67
- 10936 E Apache Trail Unit 71
- 10540 E Apache Trail Unit 93
- 10540 E Apache Trail Unit 182
- 10530 E Baltimore St
- 7000 E Arbor Ave
- 11100 E Apache Trail Unit 26
- 11100 E Apache Trail Unit 8
- 11100 E Apache Trail Unit 30
- 11100 E Apache Trail Unit 34
- 11100 E Apache Trail Unit 16
- 11100 E Apache Trail Unit 48
- 11100 E Apache Trail Unit 63
- 11020 E University Dr
- 11101 E University Dr Unit 214
- 11101 E University Dr Unit 171
- 118 N Signal Butte Rd
- 126 N Signal Butte Rd
- 102 N Signal Butte Rd
- 106 N Signal Butte Rd
- 128 N Signal Butte Rd
- 122 N Signal Butte Rd
- 110 N Signal Butte Rd
- 130 N Signal Butte Rd
- 124 N Signal Butte Rd
- 136 N Signal Butte Rd
- 136 N Signal Butte Rd
- 127 N Signal Butte Rd
- 112 N Signal Butte Rd
- 132 N Signal Butte Rd Unit D
- 134 N Signal Butte Rd
- 60 N Signal Butte Rd
- 142 N Signal Butte Rd
- 144 N Signal Butte Rd
- 148 N Signal Butte Rd
- 150 N Signal Butte Rd