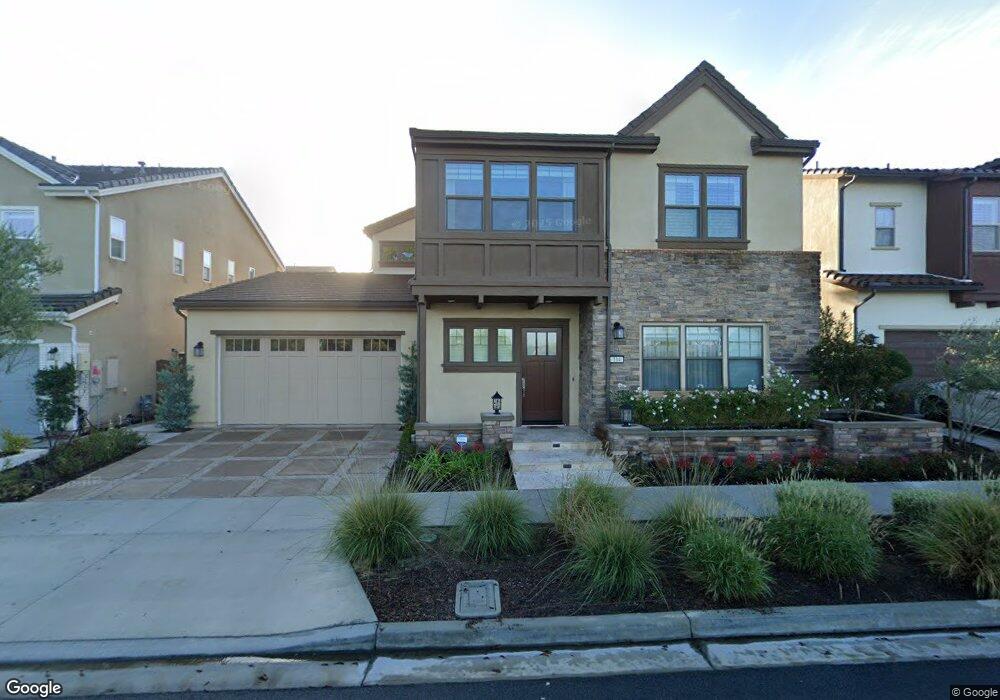
114 Perspective Irvine, CA 92618
Great Park NeighborhoodEstimated Value: $2,971,888 - $3,257,000
4
Beds
5
Baths
3,754
Sq Ft
$825/Sq Ft
Est. Value
About This Home
This home is located at 114 Perspective, Irvine, CA 92618 and is currently estimated at $3,095,972, approximately $824 per square foot. 114 Perspective is a home with nearby schools including Cadence Park, Portola High School, and Woodbury Elementary School.
Ownership History
Date
Name
Owned For
Owner Type
Purchase Details
Closed on
Nov 5, 2019
Sold by
Lennar Homes Of California Inc
Bought by
Kim Yong Sik and Kim Hee Seon
Current Estimated Value
Home Financials for this Owner
Home Financials are based on the most recent Mortgage that was taken out on this home.
Original Mortgage
$350,000
Outstanding Balance
$303,265
Interest Rate
2.87%
Mortgage Type
New Conventional
Estimated Equity
$2,792,707
Purchase Details
Closed on
Jan 30, 2019
Sold by
Cdcg 4 Len 1 Lp
Bought by
Lennar Homes Of California Inc
Purchase Details
Closed on
Aug 2, 2018
Sold by
Lenanr Homes Of Claifornia Inc
Bought by
Star Space Llc
Purchase Details
Closed on
Jul 31, 2017
Sold by
Heritage Fields El Tord Llc
Bought by
Cdcg 4 Len 1 Lp
Create a Home Valuation Report for This Property
The Home Valuation Report is an in-depth analysis detailing your home's value as well as a comparison with similar homes in the area
Home Values in the Area
Average Home Value in this Area
Purchase History
| Date | Buyer | Sale Price | Title Company |
|---|---|---|---|
| Kim Yong Sik | $1,580,000 | Calatantic Title | |
| Lennar Homes Of California Inc | $12,007,500 | First American Title Company | |
| Star Space Llc | $1,638,000 | North American Title | |
| Cdcg 4 Len 1 Lp | $54,649,500 | First American Title Company |
Source: Public Records
Mortgage History
| Date | Status | Borrower | Loan Amount |
|---|---|---|---|
| Open | Kim Yong Sik | $350,000 | |
| Closed | Cdcg 4 Len 1 Lp | $0 |
Source: Public Records
Tax History
| Year | Tax Paid | Tax Assessment Tax Assessment Total Assessment is a certain percentage of the fair market value that is determined by local assessors to be the total taxable value of land and additions on the property. | Land | Improvement |
|---|---|---|---|---|
| 2025 | $30,868 | $1,727,958 | $635,561 | $1,092,397 |
| 2024 | $30,868 | $1,694,077 | $623,099 | $1,070,978 |
| 2023 | $30,205 | $1,660,860 | $610,881 | $1,049,979 |
| 2022 | $29,612 | $1,628,295 | $598,903 | $1,029,392 |
| 2021 | $29,031 | $1,596,368 | $587,160 | $1,009,208 |
| 2020 | $28,712 | $1,580,000 | $581,140 | $998,860 |
| 2019 | $20,401 | $763,592 | $763,592 | $0 |
| 2018 | $8,090 | $748,620 | $748,620 | $0 |
| 2017 | $2,534 | $101,291 | $101,291 | $0 |
| 2016 | $2,471 | $99,305 | $99,305 | $0 |
Source: Public Records
Map
Nearby Homes
Your Personal Tour Guide
Ask me questions while you tour the home.