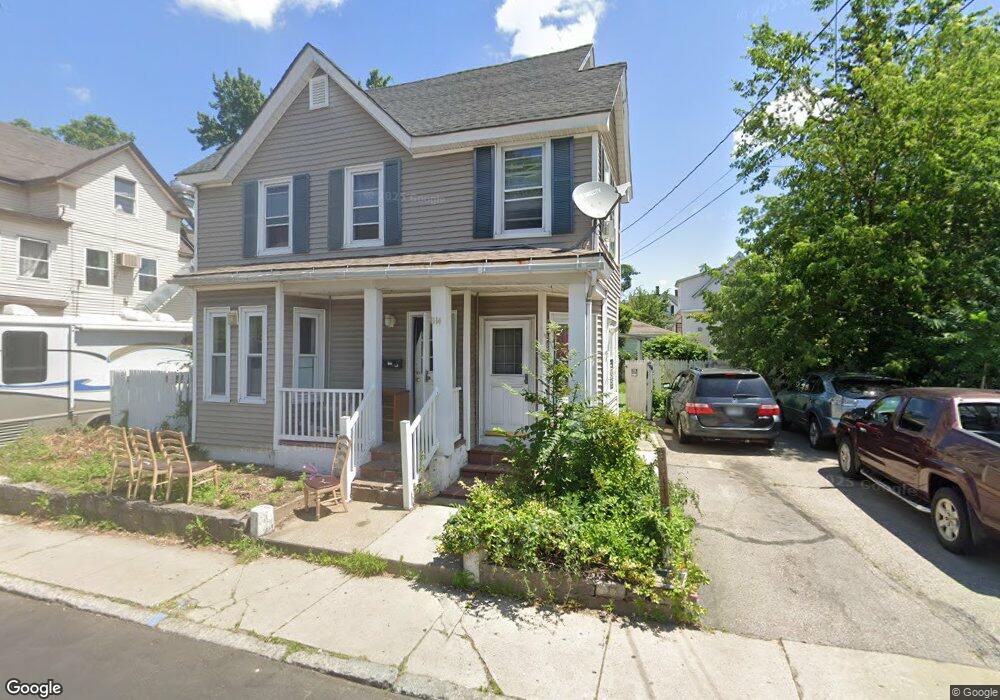
114 Pine St Nashua, NH 03060
South End Nashua NeighborhoodEstimated Value: $402,000 - $490,000
6
Beds
2
Baths
2,830
Sq Ft
$160/Sq Ft
Est. Value
About This Home
This home is located at 114 Pine St, Nashua, NH 03060 and is currently estimated at $452,507, approximately $159 per square foot. 114 Pine St is a home located in Hillsborough County with nearby schools including Fairgrounds Elementary School, Elm Street Middle School, and Nashua High School South.
Ownership History
Date
Name
Owned For
Owner Type
Purchase Details
Closed on
Sep 7, 2018
Sold by
Jaquez Rosalia and Rodriquez Sergio
Bought by
Saavedra Javier F
Current Estimated Value
Home Financials for this Owner
Home Financials are based on the most recent Mortgage that was taken out on this home.
Original Mortgage
$176,800
Outstanding Balance
$152,256
Interest Rate
4.5%
Mortgage Type
New Conventional
Estimated Equity
$300,251
Purchase Details
Closed on
Aug 14, 2006
Sold by
Stevens Gail
Bought by
Jaquez Roselia
Home Financials for this Owner
Home Financials are based on the most recent Mortgage that was taken out on this home.
Original Mortgage
$226,400
Interest Rate
6.8%
Mortgage Type
Purchase Money Mortgage
Purchase Details
Closed on
Apr 16, 2004
Sold by
Lantry Thomas A
Bought by
Stevens Gail
Purchase Details
Closed on
Dec 24, 2003
Sold by
Wright Chester C and Wright Elisa R
Bought by
Lantry Thomas A
Home Financials for this Owner
Home Financials are based on the most recent Mortgage that was taken out on this home.
Original Mortgage
$146,000
Interest Rate
6.01%
Mortgage Type
Purchase Money Mortgage
Create a Home Valuation Report for This Property
The Home Valuation Report is an in-depth analysis detailing your home's value as well as a comparison with similar homes in the area
Home Values in the Area
Average Home Value in this Area
Purchase History
| Date | Buyer | Sale Price | Title Company |
|---|---|---|---|
| Saavedra Javier F | $221,000 | -- | |
| Jaquez Roselia | $283,000 | -- | |
| Stevens Gail | $260,000 | -- | |
| Lantry Thomas A | $182,500 | -- |
Source: Public Records
Mortgage History
| Date | Status | Borrower | Loan Amount |
|---|---|---|---|
| Open | Saavedra Javier F | $176,800 | |
| Previous Owner | Lantry Thomas A | $226,400 | |
| Previous Owner | Lantry Thomas A | $25,000 | |
| Previous Owner | Lantry Thomas A | $146,000 |
Source: Public Records
Tax History
| Year | Tax Paid | Tax Assessment Tax Assessment Total Assessment is a certain percentage of the fair market value that is determined by local assessors to be the total taxable value of land and additions on the property. | Land | Improvement |
|---|---|---|---|---|
| 2025 | $6,754 | $401,300 | $115,600 | $285,700 |
| 2024 | $6,381 | $401,300 | $115,600 | $285,700 |
| 2023 | $6,311 | $346,200 | $92,500 | $253,700 |
| 2022 | $6,256 | $346,200 | $92,500 | $253,700 |
| 2021 | $5,227 | $225,100 | $61,600 | $163,500 |
| 2020 | $4,614 | $225,100 | $61,600 | $163,500 |
| 2019 | $4,550 | $225,100 | $61,600 | $163,500 |
| 2018 | $4,774 | $225,100 | $61,600 | $163,500 |
| 2017 | $4,077 | $158,100 | $59,000 | $99,100 |
| 2016 | $3,964 | $158,100 | $59,000 | $99,100 |
| 2015 | $3,878 | $158,100 | $59,000 | $99,100 |
| 2014 | $3,802 | $158,100 | $59,000 | $99,100 |
Source: Public Records
Map
Nearby Homes
Your Personal Tour Guide
Ask me questions while you tour the home.