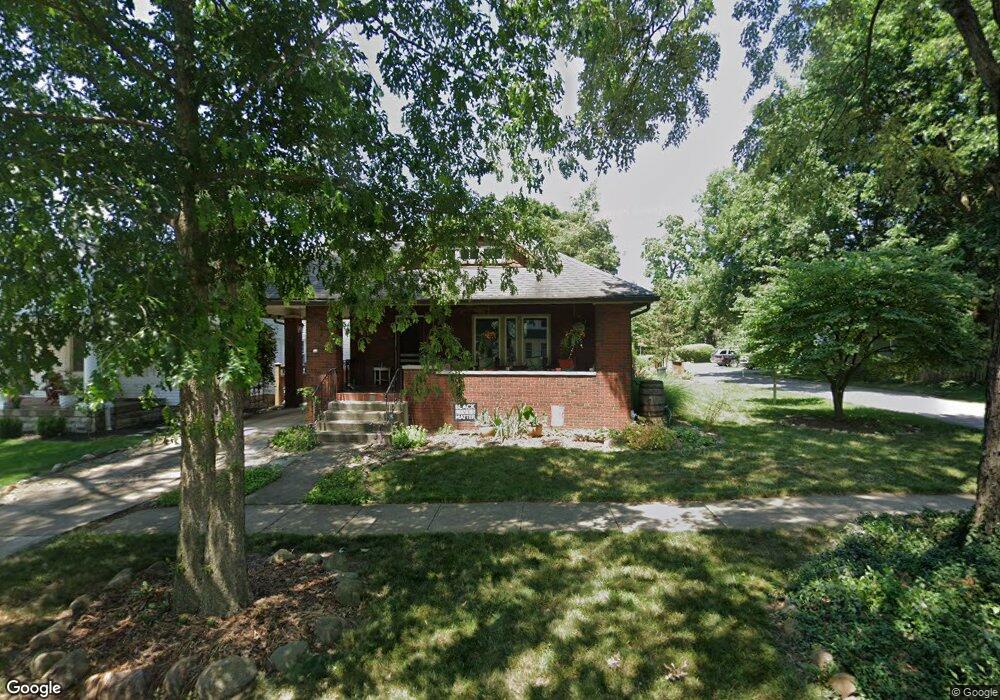
114 Richards Rd Columbus, OH 43214
Clintonville NeighborhoodEstimated Value: $468,000 - $582,000
4
Beds
1
Bath
1,670
Sq Ft
$311/Sq Ft
Est. Value
About This Home
This home is located at 114 Richards Rd, Columbus, OH 43214 and is currently estimated at $520,066, approximately $311 per square foot. 114 Richards Rd is a home located in Franklin County with nearby schools including Indian Springs Elementary School, Dominion Middle School, and Whetstone High School.
Ownership History
Date
Name
Owned For
Owner Type
Purchase Details
Closed on
May 1, 2003
Sold by
Klatt Werner G
Bought by
Kramer Eric J
Current Estimated Value
Home Financials for this Owner
Home Financials are based on the most recent Mortgage that was taken out on this home.
Original Mortgage
$165,876
Interest Rate
5.87%
Mortgage Type
Purchase Money Mortgage
Purchase Details
Closed on
Apr 25, 2001
Sold by
Klatt Robert G and Klatt Jennifer L
Bought by
Klatt Werner G
Purchase Details
Closed on
Jul 1, 1999
Sold by
Klatt Werner G and Klatt Kathryn F
Bought by
Klatt Werner G and Klatt Kathryn F
Home Financials for this Owner
Home Financials are based on the most recent Mortgage that was taken out on this home.
Original Mortgage
$307,500
Interest Rate
7.43%
Mortgage Type
Purchase Money Mortgage
Purchase Details
Closed on
Jun 10, 1976
Bought by
Chouramanis Demetra
Create a Home Valuation Report for This Property
The Home Valuation Report is an in-depth analysis detailing your home's value as well as a comparison with similar homes in the area
Home Values in the Area
Average Home Value in this Area
Purchase History
| Date | Buyer | Sale Price | Title Company |
|---|---|---|---|
| Kramer Eric J | $207,400 | -- | |
| Klatt Werner G | -- | -- | |
| Klatt Werner G | -- | Chicago Title | |
| Klatt Robert G | -- | Chicago Title | |
| Klatt Werner G | $115,000 | Chicago Title | |
| Chouramanis Demetra | -- | -- |
Source: Public Records
Mortgage History
| Date | Status | Borrower | Loan Amount |
|---|---|---|---|
| Previous Owner | Kramer Eric J | $165,876 | |
| Previous Owner | Klatt Robert G | $307,500 |
Source: Public Records
Tax History
| Year | Tax Paid | Tax Assessment Tax Assessment Total Assessment is a certain percentage of the fair market value that is determined by local assessors to be the total taxable value of land and additions on the property. | Land | Improvement |
|---|---|---|---|---|
| 2025 | $6,307 | $140,530 | $53,520 | $87,010 |
| 2024 | $6,307 | $140,530 | $53,520 | $87,010 |
| 2023 | $6,226 | $140,525 | $53,515 | $87,010 |
| 2022 | $6,951 | $134,020 | $34,900 | $99,120 |
| 2021 | $6,963 | $134,020 | $34,900 | $99,120 |
| 2020 | $6,972 | $134,020 | $34,900 | $99,120 |
| 2019 | $6,183 | $101,930 | $26,850 | $75,080 |
| 2018 | $5,655 | $101,930 | $26,850 | $75,080 |
| 2017 | $5,921 | $101,930 | $26,850 | $75,080 |
| 2016 | $5,662 | $85,480 | $29,930 | $55,550 |
| 2015 | $5,140 | $85,480 | $29,930 | $55,550 |
| 2014 | $5,153 | $85,480 | $29,930 | $55,550 |
| 2013 | $2,445 | $81,375 | $28,490 | $52,885 |
Source: Public Records
Map
Nearby Homes
- 188 Chatham Rd
- 126 Erie Rd
- 30 E Torrence Rd
- 374 Acton Rd
- 27 E Dunedin Rd
- 367 E Dunedin Rd
- 222 W North Broadway St
- 467 Brevoort Rd
- 575 Acton Rd
- 83 Clinton Heights Ave
- 263 W North Broadway St
- 84-86 W Como Ave
- 270 Clinton Heights Ave
- 243 E Schreyer Place
- 544 Piedmont Rd
- 123 W Como Ave
- 151 W Dominion Blvd
- 44 W Pacemont Rd
- 142 W Schreyer Place
- 231 W Pacemont Rd Unit 235
Your Personal Tour Guide
Ask me questions while you tour the home.