Estimated Value: $220,000 - $253,000
3
Beds
3
Baths
1,806
Sq Ft
$134/Sq Ft
Est. Value
About This Home
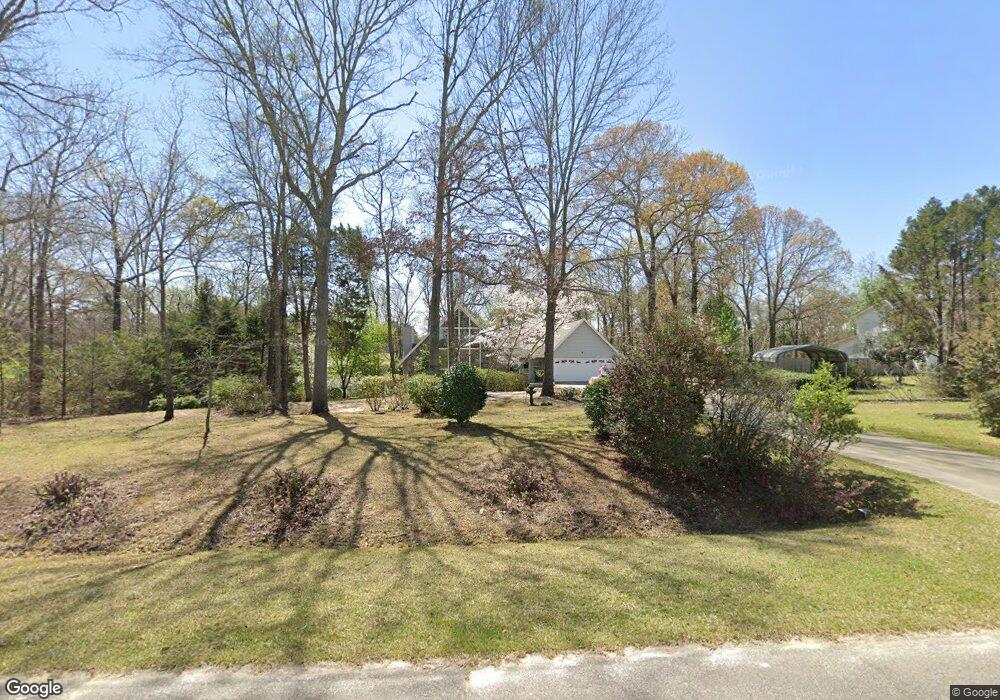
This home is located at 114 Robbie Dr, Byron, GA 31008 and is currently estimated at $242,447, approximately $134 per square foot. 114 Robbie Dr is a home located in Peach County with nearby schools including Kay Road Elementary School, Fort Valley Middle School, and Peach County High School.
Ownership History
Date
Name
Owned For
Owner Type
Purchase Details
Closed on
Oct 19, 2016
Sold by
George D
Bought by
Obrien Debra
Current Estimated Value
Purchase Details
Closed on
Jun 23, 2010
Sold by
Knowles Mary L
Bought by
Knowles George D
Home Financials for this Owner
Home Financials are based on the most recent Mortgage that was taken out on this home.
Original Mortgage
$75,765
Interest Rate
4.77%
Mortgage Type
New Conventional
Purchase Details
Closed on
Nov 3, 2004
Sold by
Darrow John B and Darrow Sr
Bought by
Knowles George D
Purchase Details
Closed on
Sep 6, 1994
Bought by
Darrow John B and Darrow Sr
Purchase Details
Closed on
May 7, 1991
Bought by
Cook Wanda S
Purchase Details
Closed on
Mar 14, 1991
Bought by
Hudson Robert W
Purchase Details
Closed on
Jan 6, 1986
Bought by
Hudson Steven Wilson and Teresa Kay
Create a Home Valuation Report for This Property
The Home Valuation Report is an in-depth analysis detailing your home's value as well as a comparison with similar homes in the area
Home Values in the Area
Average Home Value in this Area
Purchase History
| Date | Buyer | Sale Price | Title Company |
|---|---|---|---|
| Obrien Debra | $120,000 | -- | |
| Knowles George D | -- | -- | |
| Knowles George D | -- | -- | |
| Knowles George D | $128,000 | -- | |
| Darrow John B | $93,000 | -- | |
| Cook Wanda S | $10,000 | -- | |
| Hudson Robert W | -- | -- | |
| Hudson Steven Wilson | $5,700 | -- |
Source: Public Records
Mortgage History
| Date | Status | Borrower | Loan Amount |
|---|---|---|---|
| Previous Owner | Knowles George D | $75,765 |
Source: Public Records
Tax History Compared to Growth
Tax History
| Year | Tax Paid | Tax Assessment Tax Assessment Total Assessment is a certain percentage of the fair market value that is determined by local assessors to be the total taxable value of land and additions on the property. | Land | Improvement |
|---|---|---|---|---|
| 2024 | $2,312 | $64,800 | $7,080 | $57,720 |
| 2023 | $1,714 | $64,240 | $7,080 | $57,160 |
| 2022 | $1,532 | $56,920 | $7,080 | $49,840 |
| 2021 | $1,560 | $49,960 | $7,080 | $42,880 |
| 2020 | $1,561 | $50,000 | $7,080 | $42,920 |
| 2019 | $1,529 | $48,720 | $7,080 | $41,640 |
| 2018 | $1,536 | $48,720 | $7,080 | $41,640 |
| 2017 | $1,521 | $48,720 | $7,080 | $41,640 |
| 2016 | $969 | $48,720 | $7,080 | $41,640 |
| 2015 | $969 | $48,720 | $7,080 | $41,640 |
| 2014 | $969 | $48,720 | $7,080 | $41,640 |
| 2013 | -- | $48,720 | $7,080 | $41,640 |
Source: Public Records
Map
Nearby Homes
- 127 Erin Ct
- 53.91 Acres Anna Marie Circle (Autumn Cove Subdivision)
- 0 Housers Mill Rd Unit 5515996
- 1046 Walker Rd
- 0 Peavy Rd
- 199 Red Tail Cir
- 152 Hawks Ridge Trace
- 109 Red Tail Cir
- 107 Red Tail Cir
- 206 Christopher Dr
- 248 Shantz Way
- 248 Shantz Way Unit (LOT A41)
- 305 Shantz Way
- The McGinnis Plan at Bryson Farms
- The Lawson Plan at Bryson Farms
- The Coleman Plan at Bryson Farms
- The Piedmont Plan at Bryson Farms
- The Harrington Plan at Bryson Farms
- 305 Shantz Way Unit (LOT C11)
- The Benson II Plan at Bryson Farms
- 118 Robbie Dr
- 122 Robbie Dr
- 119 Robbie Dr
- 115 Robbie Dr
- 123 Robbie Dr
- 109 Robbie Dr
- 4845 Housers Mill Rd
- 115 Erin Ct
- 0 Robbie Dr Unit 8770872
- Lot 15 Robbie Dr
- 0 Robbie Dr Unit 8356807
- 0 Robbie Dr Unit LOt 15 8651974
- 0 Robbie Dr Unit LOt 15 8515484
- 0 Robbie Dr Unit Lot 15
- 127 Robbie Dr
- 111 Erin Ct
- 105 Robbie Dr
- 4835 Housers Mill Rd
- 130 Robbie Dr
- 15 Robbie Dr