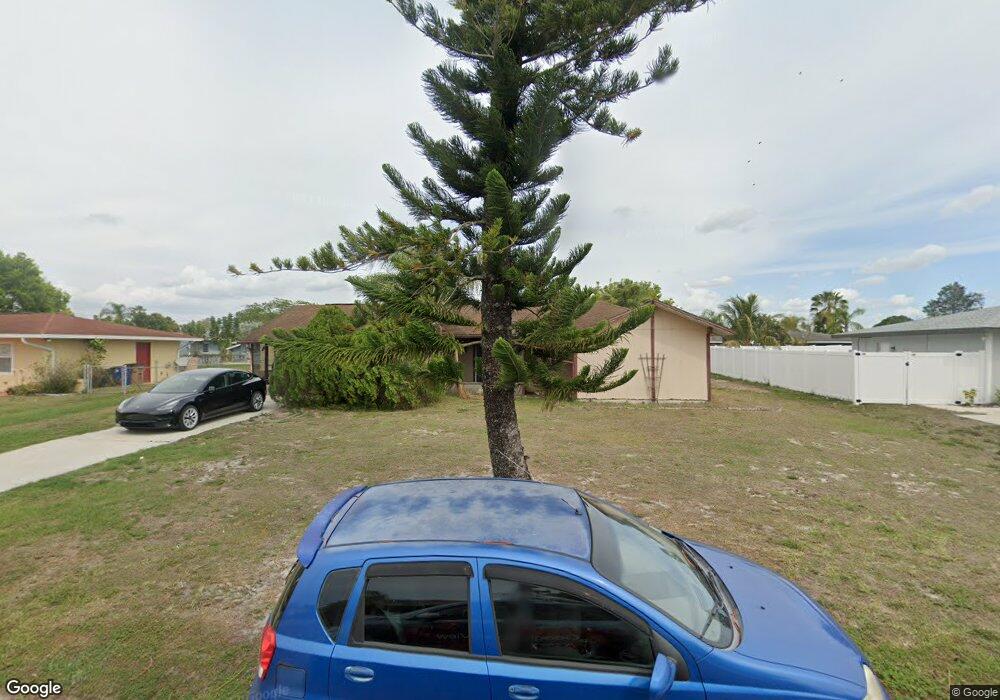
114 Rowland Rd Lehigh Acres, FL 33936
Alabama NeighborhoodEstimated Value: $211,552 - $241,000
2
Beds
2
Baths
1,196
Sq Ft
$189/Sq Ft
Est. Value
About This Home
This home is located at 114 Rowland Rd, Lehigh Acres, FL 33936 and is currently estimated at $226,638, approximately $189 per square foot. 114 Rowland Rd is a home located in Lee County with nearby schools including Lehigh Elementary School, Gateway Elementary School, and The Alva School.
Ownership History
Date
Name
Owned For
Owner Type
Purchase Details
Closed on
Aug 25, 2004
Sold by
Dehaas Dallas A and Dehaas Margaret J
Bought by
Brun Stephen R and Brun Dallas D
Current Estimated Value
Purchase Details
Closed on
Dec 23, 1998
Sold by
Brown Wilmer C
Bought by
Dehaas Dallas A and Dehaas Margaret J
Home Financials for this Owner
Home Financials are based on the most recent Mortgage that was taken out on this home.
Original Mortgage
$59,778
Interest Rate
6.87%
Mortgage Type
FHA
Purchase Details
Closed on
Jan 30, 1996
Sold by
Brown Wilmer C and Brown Lorraine A
Bought by
Brown Wilmer C and Brown Rev Li Li A
Purchase Details
Closed on
Oct 28, 1993
Sold by
Carter Martin J and Carter Sharon K
Bought by
Brown Wilmer C and Brown Lorraine A
Home Financials for this Owner
Home Financials are based on the most recent Mortgage that was taken out on this home.
Original Mortgage
$21,000
Interest Rate
7.03%
Create a Home Valuation Report for This Property
The Home Valuation Report is an in-depth analysis detailing your home's value as well as a comparison with similar homes in the area
Home Values in the Area
Average Home Value in this Area
Purchase History
| Date | Buyer | Sale Price | Title Company |
|---|---|---|---|
| Brun Stephen R | $27,500 | Real Estate Title Services L | |
| Dehaas Dallas A | $61,400 | -- | |
| Brown Wilmer C | -- | -- | |
| Brown Wilmer C | $61,000 | -- |
Source: Public Records
Mortgage History
| Date | Status | Borrower | Loan Amount |
|---|---|---|---|
| Previous Owner | Dehaas Dallas A | $59,778 | |
| Previous Owner | Brown Wilmer C | $21,000 |
Source: Public Records
Tax History Compared to Growth
Tax History
| Year | Tax Paid | Tax Assessment Tax Assessment Total Assessment is a certain percentage of the fair market value that is determined by local assessors to be the total taxable value of land and additions on the property. | Land | Improvement |
|---|---|---|---|---|
| 2025 | $869 | $36,275 | -- | -- |
| 2024 | $791 | $35,253 | -- | -- |
| 2023 | $791 | $34,226 | $0 | $0 |
| 2022 | $711 | $33,229 | $0 | $0 |
| 2021 | $632 | $102,019 | $9,450 | $92,569 |
| 2020 | $615 | $31,816 | $0 | $0 |
| 2019 | $699 | $31,101 | $0 | $0 |
| 2018 | $667 | $30,521 | $0 | $0 |
| 2017 | $620 | $29,893 | $0 | $0 |
| 2016 | $585 | $58,897 | $7,950 | $50,947 |
| 2015 | $575 | $50,004 | $6,625 | $43,379 |
| 2014 | $346 | $45,196 | $5,085 | $40,111 |
| 2013 | -- | $35,695 | $3,500 | $32,195 |
Source: Public Records
Map
Nearby Homes
- 108 Contee Dr
- 101 Durland Ave
- 1423 Alwynne Dr
- 1543 Medford Place
- 1438 Caywood Cir N
- 9749 Maplecrest Cir
- 217 Beth Stacey Blvd
- 211 Oakmont Pkwy
- 9817 Maplecrest Cir
- 2508 9th St SW
- 220 Oakmont Pkwy
- 227 Beth Stacey Blvd
- 2513 10th St SW
- 0 Beth Stacey Blvd
- 2504 5th St SW
- 2605 6th St SW
- 20 Cosmopolitan Dr Unit 5
- 2511 12th St SW
- 2517 11th St SW
- 312 Grovewood Ave S
- 116 Rowland Rd
- 112 Rowland Rd
- 113 Stafford Place
- 111 Stafford Place
- 115 Stafford Place
- 115 Rowland Rd
- 118 Rowland Rd
- 110 Rowland Rd
- 113 Rowland Rd
- 117 Rowland Rd
- 117 Stafford Place
- 109 Stafford Place
- 111 Rowland Rd
- 119 Rowland Rd
- 108 Rowland Rd
- 120 Rowland Rd
- 112 Stafford Place
- 110 Contee Dr
- 107 Stafford Place
- 114 Contee Dr