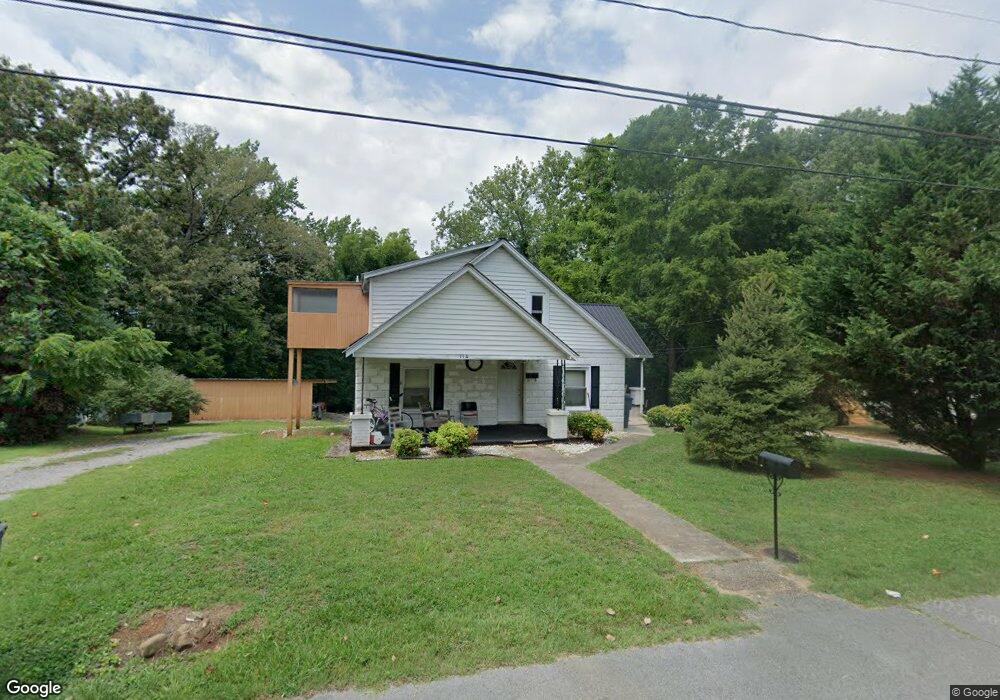
114 Ruby St McMinnville, TN 37110
Estimated Value: $122,888 - $233,000
--
Bed
2
Baths
1,757
Sq Ft
$106/Sq Ft
Est. Value
About This Home
This home is located at 114 Ruby St, McMinnville, TN 37110 and is currently estimated at $186,222, approximately $105 per square foot. 114 Ruby St is a home located in Warren County with nearby schools including Bobby Ray Memorial Elementary School, Warren County Middle School, and Warren County High School.
Ownership History
Date
Name
Owned For
Owner Type
Purchase Details
Closed on
Mar 15, 2013
Sold by
Mullican James Daniel
Bought by
Malone Anthony and Malone Darlene
Current Estimated Value
Purchase Details
Closed on
Dec 30, 2008
Sold by
U S Bank National
Bought by
Mullican James Daniel
Home Financials for this Owner
Home Financials are based on the most recent Mortgage that was taken out on this home.
Original Mortgage
$21,619
Interest Rate
5.48%
Purchase Details
Closed on
Jun 9, 2008
Sold by
Rucker Angela C
Bought by
U S Bank National
Purchase Details
Closed on
Mar 16, 2000
Sold by
Rucker Angela C
Bought by
Sontag Michael D
Purchase Details
Closed on
Apr 24, 1998
Bought by
Rucker Raymond M and Rucker Angela
Purchase Details
Closed on
May 2, 1994
Sold by
Deceder Mary F
Bought by
Jeffery Davis and Jeffery Heather
Purchase Details
Closed on
Apr 29, 1994
Bought by
Davis Jeffery W and Davis Heather O
Purchase Details
Closed on
Sep 11, 1987
Bought by
Deceder John F and Deceder Mary
Create a Home Valuation Report for This Property
The Home Valuation Report is an in-depth analysis detailing your home's value as well as a comparison with similar homes in the area
Home Values in the Area
Average Home Value in this Area
Purchase History
| Date | Buyer | Sale Price | Title Company |
|---|---|---|---|
| Malone Anthony | $8,000 | -- | |
| Mullican James Daniel | $25,000 | -- | |
| U S Bank National | $31,900 | -- | |
| Sontag Michael D | -- | -- | |
| Rucker Raymond M | $55,000 | -- | |
| Jeffery Davis | -- | -- | |
| Davis Jeffery W | $41,000 | -- | |
| Deceder John F | -- | -- |
Source: Public Records
Mortgage History
| Date | Status | Borrower | Loan Amount |
|---|---|---|---|
| Previous Owner | Deceder John F | $21,619 |
Source: Public Records
Tax History Compared to Growth
Tax History
| Year | Tax Paid | Tax Assessment Tax Assessment Total Assessment is a certain percentage of the fair market value that is determined by local assessors to be the total taxable value of land and additions on the property. | Land | Improvement |
|---|---|---|---|---|
| 2025 | -- | $20,450 | $0 | $0 |
| 2024 | -- | $9,725 | $2,250 | $7,475 |
| 2023 | $395 | $9,725 | $2,250 | $7,475 |
| 2022 | $371 | $9,725 | $2,250 | $7,475 |
| 2021 | $371 | $9,725 | $2,250 | $7,475 |
| 2020 | $180 | $9,725 | $2,250 | $7,475 |
| 2019 | $406 | $9,375 | $2,250 | $7,125 |
| 2018 | $379 | $9,375 | $2,250 | $7,125 |
| 2017 | $379 | $9,375 | $2,250 | $7,125 |
| 2016 | $379 | $9,375 | $2,250 | $7,125 |
| 2015 | $382 | $9,375 | $2,250 | $7,125 |
| 2014 | $441 | $9,375 | $2,250 | $7,125 |
| 2013 | $441 | $10,798 | $0 | $0 |
Source: Public Records
Map
Nearby Homes
- 215 W Sparta St
- 102 W Sparta St
- 510 Sparta St
- 126 Lance St
- 110 Warren St
- 105 Warren St
- 308 Dekalb St
- 108 Van Buren St
- 635 N Spring St
- 300 Dekalb St
- 108 King St
- 118 Van Buren St
- 104 Virginia St
- 107 Grundy St
- 100 Holly St
- 102 Taft St
- 308 Lind St
- 209 S High St Unit 19
- 211 S High St Unit 22
- 117 Garfield St