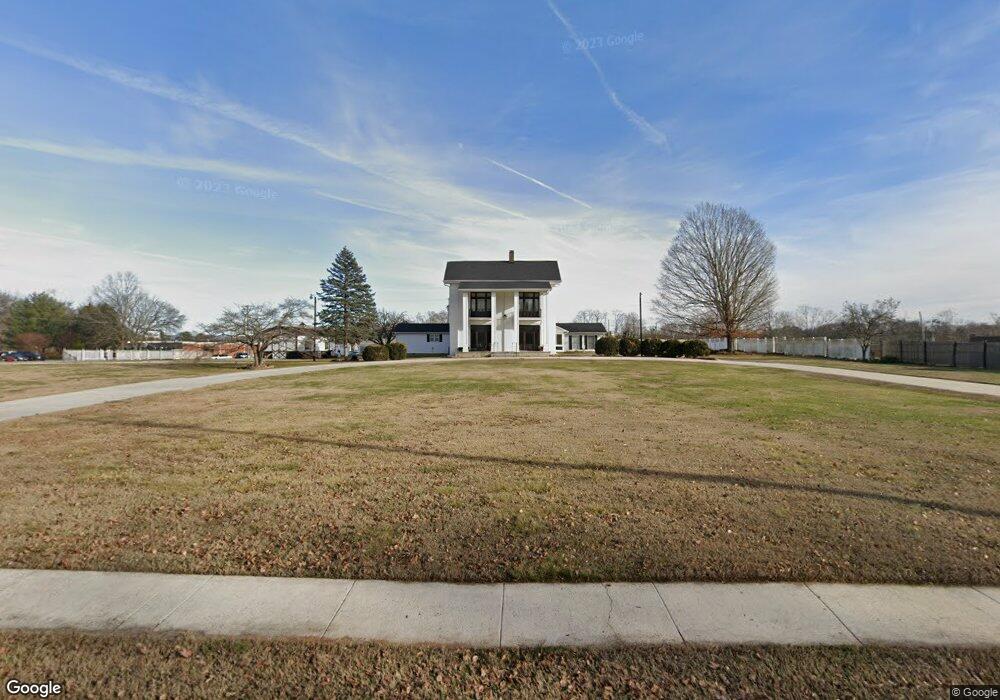
114 Sharp Springs Rd Winchester, TN 37398
Estimated Value: $574,000 - $736,000
--
Bed
5
Baths
5,509
Sq Ft
$124/Sq Ft
Est. Value
About This Home
This home is located at 114 Sharp Springs Rd, Winchester, TN 37398 and is currently estimated at $683,209, approximately $124 per square foot. 114 Sharp Springs Rd is a home located in Franklin County with nearby schools including North Middle School, Franklin County High School, and Winchester Christian Academy.
Ownership History
Date
Name
Owned For
Owner Type
Purchase Details
Closed on
Mar 31, 2012
Sold by
Armstrong Marie T
Bought by
Evans Howard
Current Estimated Value
Purchase Details
Closed on
May 12, 2005
Sold by
Traders National Bank
Bought by
Armstrong Marie T
Home Financials for this Owner
Home Financials are based on the most recent Mortgage that was taken out on this home.
Original Mortgage
$160,000
Interest Rate
5.8%
Purchase Details
Closed on
Sep 1, 2004
Bought by
Traders National Bk
Purchase Details
Closed on
Jan 23, 2004
Sold by
Holland Lana J
Bought by
Holland Brian R
Purchase Details
Closed on
May 18, 2000
Sold by
Tamai Masaaki
Bought by
Holland Brian R and Holland Lana J
Purchase Details
Closed on
Jul 16, 1998
Sold by
Tamai Akemi
Bought by
Tamai Masaaki
Purchase Details
Closed on
Mar 8, 1995
Sold by
Zelko Timothy J
Bought by
Tamai Akemi
Purchase Details
Closed on
Sep 24, 1993
Bought by
Zelko Timothy J and Zelko Kimberly K
Purchase Details
Closed on
Oct 18, 1983
Purchase Details
Closed on
Oct 9, 1951
Bought by
Fite Fite A and Fite Louise
Purchase Details
Closed on
Oct 1, 1951
Create a Home Valuation Report for This Property
The Home Valuation Report is an in-depth analysis detailing your home's value as well as a comparison with similar homes in the area
Home Values in the Area
Average Home Value in this Area
Purchase History
| Date | Buyer | Sale Price | Title Company |
|---|---|---|---|
| Evans Howard | -- | -- | |
| Armstrong Marie T | $200,000 | -- | |
| Traders National Bk | $200,000 | -- | |
| Holland Brian R | -- | -- | |
| Holland Brian R | $229,000 | -- | |
| Tamai Masaaki | -- | -- | |
| Tamai Akemi | $195,000 | -- | |
| Zelko Timothy J | -- | -- | |
| -- | -- | -- | |
| Fite Fite A | -- | -- | |
| -- | -- | -- |
Source: Public Records
Mortgage History
| Date | Status | Borrower | Loan Amount |
|---|---|---|---|
| Previous Owner | Not Available | $160,000 |
Source: Public Records
Tax History Compared to Growth
Tax History
| Year | Tax Paid | Tax Assessment Tax Assessment Total Assessment is a certain percentage of the fair market value that is determined by local assessors to be the total taxable value of land and additions on the property. | Land | Improvement |
|---|---|---|---|---|
| 2024 | $3,293 | $128,075 | $16,675 | $111,400 |
| 2023 | $3,293 | $128,075 | $16,675 | $111,400 |
| 2022 | $3,229 | $128,075 | $16,675 | $111,400 |
| 2021 | $2,348 | $128,075 | $16,675 | $111,400 |
| 2020 | $3,240 | $91,675 | $13,125 | $78,550 |
| 2019 | $3,116 | $91,675 | $13,125 | $78,550 |
| 2018 | $2,936 | $88,175 | $13,125 | $75,050 |
| 2017 | $2,936 | $88,175 | $13,125 | $75,050 |
| 2016 | $2,943 | $88,400 | $13,125 | $75,275 |
| 2015 | $2,889 | $88,400 | $13,125 | $75,275 |
| 2014 | $2,824 | $86,388 | $0 | $0 |
Source: Public Records
Map
Nearby Homes
- 103 Lisa Cir
- 0 N Porter St
- 303 N Porter St
- 203 3rd Ave NE
- 510 N Porter St
- 201&203 3rd Ave NE
- 211 S Porter St
- 213 S Porter St
- 215 S Porter St
- 209 N Jefferson St
- 311 N Jefferson St
- 0 Milton Ln
- 713 Hunt St
- 1106 Old Cowan Rd
- 709 Hunt St
- 0 Spring Hill Dr
- 203 Campfire Ct
- 0 Old Cowan Rd Unit RTC2970796
- 1019 Old Cowan Rd
- 120 Dogwood Ln
- 625 Dinah Shore Blvd
- 110 Sharp Springs Rd
- 108 Sharp Springs Rd
- 115 Sharp Springs Rd
- 201 Sharp Springs Rd
- 507 Dinah Shore Blvd
- 106 Sharp Springs Rd
- 560 Dinah Shore Blvd
- 209 Sharp Springs Rd
- 632 Dinah Shore Blvd
- 7 Brandi Way
- 630 Dinah Shore Blvd
- 211 Sharp Springs Rd
- 102 Brandi Way
- 107 Sharp Springs Rd
- 620 Dinah Shore Blvd
- 0 Sharp Springs Rd Unit RTC2809821
- 0 Sharp Springs Rd Unit RTC1766337
- 0 Sharp Springs Rd Unit 1231315
- 0 Sharp Springs Rd Unit 1239493