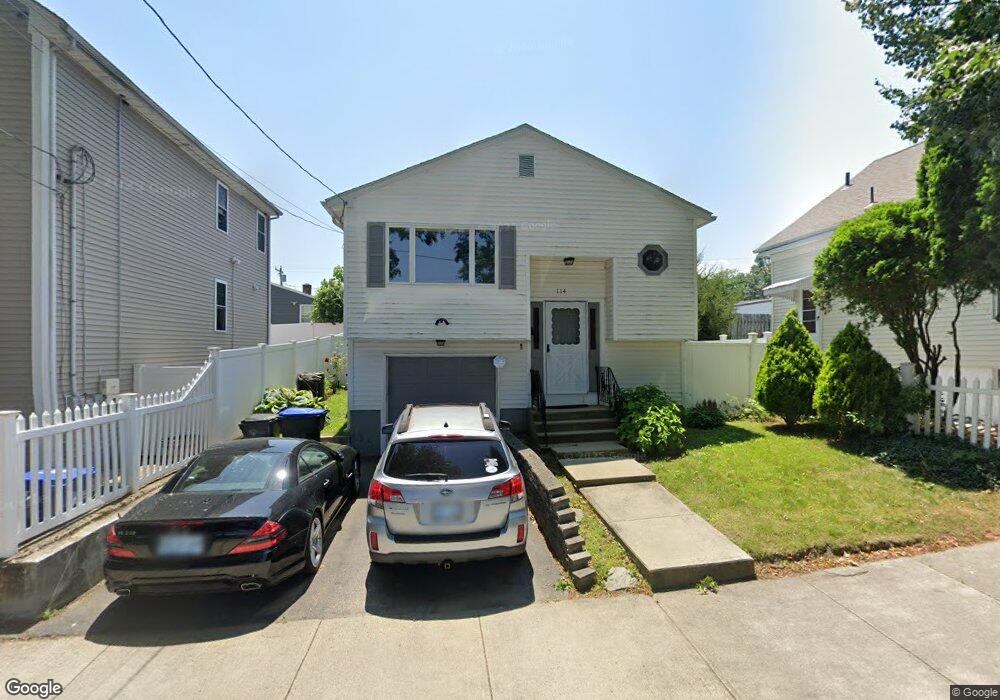
114 Swift St Providence, RI 02904
Charles NeighborhoodEstimated Value: $353,638 - $432,000
3
Beds
2
Baths
996
Sq Ft
$390/Sq Ft
Est. Value
About This Home
This home is located at 114 Swift St, Providence, RI 02904 and is currently estimated at $388,910, approximately $390 per square foot. 114 Swift St is a home located in Providence County with nearby schools including Times Squared Academy, The San Miguel School, and Bishop Keough Regional High School.
Ownership History
Date
Name
Owned For
Owner Type
Purchase Details
Closed on
Aug 16, 1993
Sold by
Fagan Dennis Frank and Fagan Anita
Bought by
Butler Harry W and Butler Brenda
Current Estimated Value
Home Financials for this Owner
Home Financials are based on the most recent Mortgage that was taken out on this home.
Original Mortgage
$100,000
Interest Rate
7.16%
Mortgage Type
VA
Purchase Details
Closed on
Oct 31, 1988
Sold by
Dippolito Michael
Bought by
Fagan Dennis
Home Financials for this Owner
Home Financials are based on the most recent Mortgage that was taken out on this home.
Original Mortgage
$93,600
Interest Rate
10.32%
Create a Home Valuation Report for This Property
The Home Valuation Report is an in-depth analysis detailing your home's value as well as a comparison with similar homes in the area
Home Values in the Area
Average Home Value in this Area
Purchase History
| Date | Buyer | Sale Price | Title Company |
|---|---|---|---|
| Butler Harry W | $100,000 | -- | |
| Fagan Dennis | $117,000 | -- |
Source: Public Records
Mortgage History
| Date | Status | Borrower | Loan Amount |
|---|---|---|---|
| Open | Fagan Dennis | $135,000 | |
| Closed | Fagan Dennis | $25,000 | |
| Closed | Fagan Dennis | $100,000 | |
| Previous Owner | Fagan Dennis | $93,600 |
Source: Public Records
Tax History
| Year | Tax Paid | Tax Assessment Tax Assessment Total Assessment is a certain percentage of the fair market value that is determined by local assessors to be the total taxable value of land and additions on the property. | Land | Improvement |
|---|---|---|---|---|
| 2025 | $2,889 | $343,900 | $126,700 | $217,200 |
| 2024 | $4,743 | $258,500 | $83,200 | $175,300 |
| 2023 | $4,743 | $258,500 | $83,200 | $175,300 |
| 2022 | $4,601 | $258,500 | $83,200 | $175,300 |
| 2021 | $4,431 | $180,400 | $60,300 | $120,100 |
| 2020 | $4,431 | $180,400 | $60,300 | $120,100 |
| 2019 | $4,431 | $180,400 | $60,300 | $120,100 |
| 2018 | $4,494 | $140,600 | $46,600 | $94,000 |
| 2017 | $4,494 | $140,600 | $46,600 | $94,000 |
| 2016 | $4,494 | $140,600 | $46,600 | $94,000 |
| 2015 | $4,055 | $122,500 | $47,200 | $75,300 |
| 2014 | $4,134 | $122,500 | $47,200 | $75,300 |
| 2013 | $4,134 | $122,500 | $47,200 | $75,300 |
Source: Public Records
Map
Nearby Homes
Your Personal Tour Guide
Ask me questions while you tour the home.