Estimated Value: $109,789 - $205,000
--
Bed
1
Bath
1,104
Sq Ft
$139/Sq Ft
Est. Value
About This Home
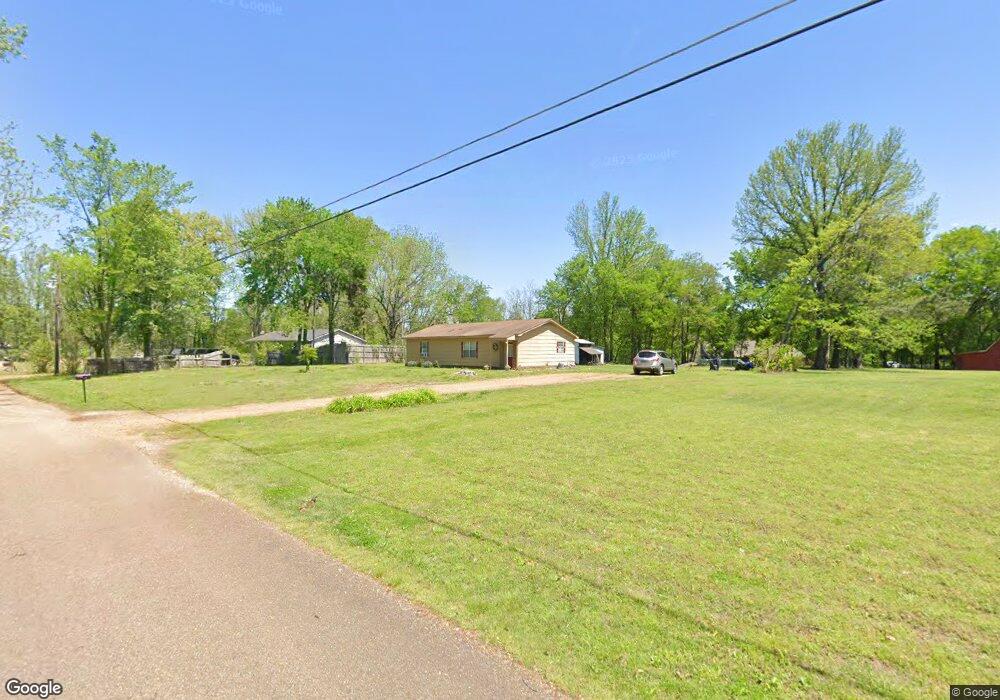
This home is located at 114 Talley Rd, Atoka, TN 38004 and is currently estimated at $153,697, approximately $139 per square foot. 114 Talley Rd is a home located in Tipton County with nearby schools including Atoka Elementary School, Brighton Middle School, and Brighton High School.
Ownership History
Date
Name
Owned For
Owner Type
Purchase Details
Closed on
May 15, 2025
Sold by
Nash Minnie and Nash Sierra
Bought by
Minnie Nash Living Trust and Nash
Current Estimated Value
Purchase Details
Closed on
Jun 24, 2024
Sold by
Nash Minnie
Bought by
Nash Sierra
Purchase Details
Closed on
Feb 12, 2018
Sold by
Stanle Sutherland Lawrence
Bought by
Nash Minnie
Purchase Details
Closed on
Nov 17, 2017
Sold by
Malecki Sutherl Laura L
Bought by
Sutherland Lawrence Stanley and Sutherland Michael Clayton
Purchase Details
Closed on
Dec 30, 2011
Sold by
Malecki-Sutherl Laura L
Bought by
Malecki-Sutherl Laura L and Sutherland Michael C
Purchase Details
Closed on
Dec 12, 1991
Bought by
Malecki-Sutherland Laura
Purchase Details
Closed on
Aug 21, 1986
Bought by
Woody Steven H and Woody Laura
Purchase Details
Closed on
Aug 8, 1985
Purchase Details
Closed on
May 3, 1984
Purchase Details
Closed on
Jan 1, 1984
Purchase Details
Closed on
Jan 1, 1983
Purchase Details
Closed on
Jan 1, 1979
Create a Home Valuation Report for This Property
The Home Valuation Report is an in-depth analysis detailing your home's value as well as a comparison with similar homes in the area
Home Values in the Area
Average Home Value in this Area
Purchase History
| Date | Buyer | Sale Price | Title Company |
|---|---|---|---|
| Minnie Nash Living Trust | -- | None Listed On Document | |
| Nash Sierra | -- | None Listed On Document | |
| Nash Minnie | $16,000 | -- | |
| Sutherland Lawrence Stanley | -- | -- | |
| Malecki-Sutherl Laura L | -- | -- | |
| Malecki-Sutherland Laura | -- | -- | |
| Woody Steven H | $15,000 | -- | |
| -- | -- | -- | |
| -- | -- | -- | |
| -- | $27,300 | -- | |
| -- | $28,100 | -- | |
| -- | $25,100 | -- |
Source: Public Records
Tax History Compared to Growth
Tax History
| Year | Tax Paid | Tax Assessment Tax Assessment Total Assessment is a certain percentage of the fair market value that is determined by local assessors to be the total taxable value of land and additions on the property. | Land | Improvement |
|---|---|---|---|---|
| 2024 | $338 | $22,225 | $5,350 | $16,875 |
| 2023 | $338 | $22,225 | $5,350 | $16,875 |
| 2022 | $319 | $15,650 | $3,925 | $11,725 |
| 2021 | $319 | $15,650 | $3,925 | $11,725 |
| 2020 | $319 | $15,650 | $3,925 | $11,725 |
| 2019 | $274 | $11,325 | $3,475 | $7,850 |
| 2018 | $274 | $11,325 | $3,475 | $7,850 |
| 2017 | $274 | $11,325 | $3,475 | $7,850 |
| 2016 | $274 | $11,325 | $3,475 | $7,850 |
| 2015 | $274 | $11,325 | $3,475 | $7,850 |
| 2014 | $274 | $11,338 | $0 | $0 |
Source: Public Records
Map
Nearby Homes
- 370 Talley Rd
- 295 Shannon Ln
- 260 Chisolm Trail
- 139 Sharon St
- 96 Sharon St
- 60 Drysdale Cove
- 50 Drysdale Cove
- 35 Drysdale Cove
- 000 Atoka Idaville Rd
- 236 Como Ln
- 29 Merino Dr
- 0 Dunlap Orphanage Rd Unit 21216554
- 0 Dunlap Orphanage Rd Unit 10175430
- 0 Atoka Idaville Rd Unit 10195990
- 125 Columbia Way
- 170 Como Ln
- 0 Atoka McLaughlin Dr
- 284 Merino Dr
- 03 Atoka Idaville Rd
- 02 Atoka Idaville Rd
- 106 Talley Rd
- 70 Talley Rd
- 168 Talley Rd
- 91 Talley Rd
- 91 Talley Rd
- 217 Talley Rd
- 1057 Faulkner Rd
- 1085 Faulkner Rd
- 209 Talley Rd
- 1001 Faulkner Rd
- 276 Talley Rd
- 265 Talley Rd
- 1149 Faulkner Rd
- 1034 Faulkner Rd
- 1004 Faulkner Rd
- 972 Faulkner Rd
- 1108 Faulkner Rd
- 1197 Faulkner Rd
- 954 Faulkner Rd
- 1058 Faulkner Rd