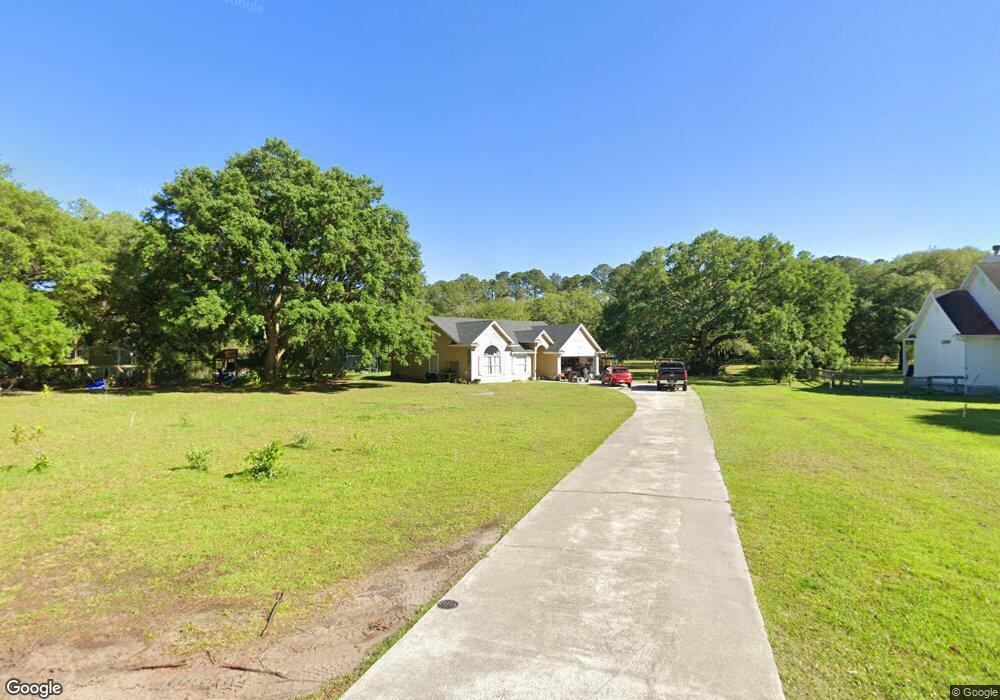
114 Wendy Ln Unit WARBLER CT Saint Marys, GA 31558
Estimated Value: $292,000 - $338,000
4
Beds
2
Baths
1,448
Sq Ft
$217/Sq Ft
Est. Value
About This Home
This home is located at 114 Wendy Ln Unit WARBLER CT, Saint Marys, GA 31558 and is currently estimated at $314,256, approximately $217 per square foot. 114 Wendy Ln Unit WARBLER CT is a home located in Camden County with nearby schools including Saint Marys Elementary School, Saint Marys Middle School, and Camden County High School.
Ownership History
Date
Name
Owned For
Owner Type
Purchase Details
Closed on
Mar 3, 2023
Sold by
Garrett Wade Thomas
Bought by
Garrett Wade Thomas and Dobbins Megan
Current Estimated Value
Purchase Details
Closed on
Mar 15, 2022
Sold by
Caison Megan
Bought by
Garrett Wade Thomas
Home Financials for this Owner
Home Financials are based on the most recent Mortgage that was taken out on this home.
Original Mortgage
$260,988
Interest Rate
3.69%
Mortgage Type
FHA
Purchase Details
Closed on
Jun 8, 2017
Sold by
Barnes Michael Jerome
Bought by
Caison Megan
Home Financials for this Owner
Home Financials are based on the most recent Mortgage that was taken out on this home.
Original Mortgage
$132,907
Interest Rate
4.37%
Mortgage Type
FHA
Create a Home Valuation Report for This Property
The Home Valuation Report is an in-depth analysis detailing your home's value as well as a comparison with similar homes in the area
Home Values in the Area
Average Home Value in this Area
Purchase History
| Date | Buyer | Sale Price | Title Company |
|---|---|---|---|
| Garrett Wade Thomas | -- | -- | |
| Garrett Wade Thomas | $285,000 | -- | |
| Caison Megan | $135,360 | -- |
Source: Public Records
Mortgage History
| Date | Status | Borrower | Loan Amount |
|---|---|---|---|
| Previous Owner | Garrett Wade Thomas | $260,988 | |
| Previous Owner | Caison Megan | $132,907 |
Source: Public Records
Tax History Compared to Growth
Tax History
| Year | Tax Paid | Tax Assessment Tax Assessment Total Assessment is a certain percentage of the fair market value that is determined by local assessors to be the total taxable value of land and additions on the property. | Land | Improvement |
|---|---|---|---|---|
| 2025 | $3,559 | $128,424 | $22,000 | $106,424 |
| 2024 | $3,704 | $114,707 | $22,000 | $92,707 |
| 2023 | $3,926 | $110,627 | $22,560 | $88,067 |
| 2022 | $1,584 | $72,480 | $11,280 | $61,200 |
| 2021 | $1,674 | $61,372 | $11,280 | $50,092 |
| 2020 | $1,721 | $58,152 | $11,280 | $46,872 |
| 2019 | $1,849 | $58,152 | $11,280 | $46,872 |
| 2018 | $378 | $58,152 | $11,280 | $46,872 |
| 2017 | $1,302 | $47,320 | $11,280 | $36,040 |
| 2016 | $1,302 | $47,942 | $11,280 | $36,662 |
| 2015 | $1,261 | $47,942 | $11,280 | $36,662 |
| 2014 | $1,255 | $47,942 | $11,280 | $36,662 |
Source: Public Records
Map
Nearby Homes
- 0 Palmetto St Unit 1658173
- 0 Palmetto St Unit 10648920
- 113 Inlet Reach Cir
- 0 Inlet Reach Cir Unit 10615187
- 124 Deep Bay Cir
- 107 Elmo H Cir
- 203 Liz Moody Blvd
- Lot 1B Dufour Rd
- 100 Eva Dr
- 6 Dufour St
- 4 Dufour St
- 2 Dufour St
- 14 Dufour St
- 7 Dufour St
- 3 Dufour St
- 13 Dufour St
- 5 Dufour St
- 15 Dufour St
- 56 Hayden Dr
- V/L 1005 Doubloon Ct