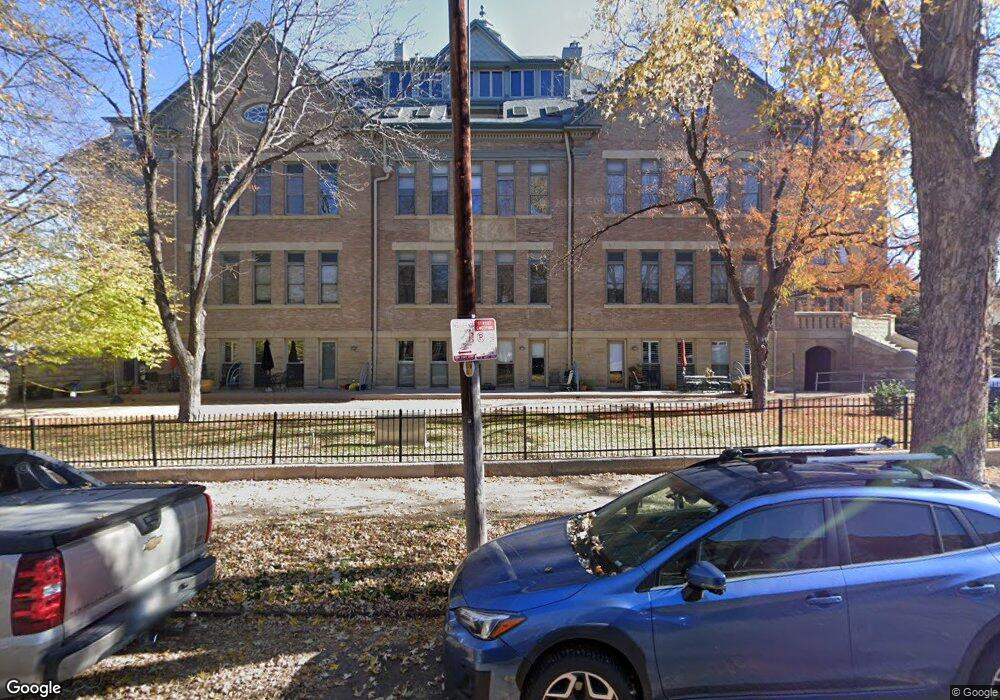
1140 Columbine St Unit 402 Denver, CO 80206
Congress Park NeighborhoodEstimated Value: $600,509 - $881,000
2
Beds
2
Baths
1,450
Sq Ft
$479/Sq Ft
Est. Value
About This Home
This home is located at 1140 Columbine St Unit 402, Denver, CO 80206 and is currently estimated at $694,627, approximately $479 per square foot. 1140 Columbine St Unit 402 is a home located in Denver County with nearby schools including Teller Elementary School, Morey Middle School, and East High School.
Ownership History
Date
Name
Owned For
Owner Type
Purchase Details
Closed on
Apr 3, 2024
Sold by
Williams Bill T
Bought by
Wtw Canyon Glow Trust
Current Estimated Value
Purchase Details
Closed on
Aug 13, 2009
Sold by
Holman Joshua Conner
Bought by
Williams Bill T
Home Financials for this Owner
Home Financials are based on the most recent Mortgage that was taken out on this home.
Original Mortgage
$200,000
Interest Rate
5.31%
Mortgage Type
Purchase Money Mortgage
Purchase Details
Closed on
Apr 27, 2006
Sold by
Laycob Jordon S
Bought by
Holman Joshua Conner
Home Financials for this Owner
Home Financials are based on the most recent Mortgage that was taken out on this home.
Original Mortgage
$150,000
Interest Rate
5%
Mortgage Type
Purchase Money Mortgage
Purchase Details
Closed on
Apr 5, 1996
Sold by
Alternatives Ltd Of Denver
Bought by
Laycob Jordon S
Create a Home Valuation Report for This Property
The Home Valuation Report is an in-depth analysis detailing your home's value as well as a comparison with similar homes in the area
Home Values in the Area
Average Home Value in this Area
Purchase History
| Date | Buyer | Sale Price | Title Company |
|---|---|---|---|
| Wtw Canyon Glow Trust | $500 | None Listed On Document | |
| Williams Bill T | $370,000 | Security Title | |
| Holman Joshua Conner | $345,000 | None Available | |
| Laycob Jordon S | $193,000 | Land Title |
Source: Public Records
Mortgage History
| Date | Status | Borrower | Loan Amount |
|---|---|---|---|
| Previous Owner | Williams Bill T | $200,000 | |
| Previous Owner | Holman Joshua Conner | $150,000 |
Source: Public Records
Tax History Compared to Growth
Tax History
| Year | Tax Paid | Tax Assessment Tax Assessment Total Assessment is a certain percentage of the fair market value that is determined by local assessors to be the total taxable value of land and additions on the property. | Land | Improvement |
|---|---|---|---|---|
| 2024 | $2,626 | $39,860 | $4,640 | $35,220 |
| 2023 | $2,569 | $39,860 | $4,640 | $35,220 |
| 2022 | $3,021 | $37,990 | $8,630 | $29,360 |
| 2021 | $2,916 | $39,080 | $8,880 | $30,200 |
| 2020 | $2,899 | $39,070 | $7,840 | $31,230 |
| 2019 | $2,818 | $39,070 | $7,840 | $31,230 |
| 2018 | $2,502 | $32,340 | $6,840 | $25,500 |
| 2017 | $2,495 | $32,340 | $6,840 | $25,500 |
| 2016 | $2,427 | $29,760 | $6,400 | $23,360 |
| 2015 | $2,325 | $29,760 | $6,400 | $23,360 |
| 2014 | $2,340 | $28,180 | $5,604 | $22,576 |
Source: Public Records
Map
Nearby Homes
- 1204 Columbine St Unit 1206
- 1111 Clayton St
- 1245 Columbine St Unit 101
- 1245 Columbine St Unit 306
- 2717 E 11th Ave
- 1265 Elizabeth St Unit 305
- 1265 Elizabeth St Unit 207
- 1160 York St
- 1284 Columbine St Unit 2
- 1260 York St Unit 208
- 1176 Gaylord St Unit 101
- 1114 Gaylord St
- 1365 Columbine St Unit 407
- 1365 Columbine St Unit 206
- 1365 Columbine St Unit 204
- 1350 Josephine St Unit 101
- 1350 Josephine St Unit 401
- 1330 York St
- 1243 Gaylord St Unit 302
- 1150 Vine St Unit 902
- 1140 Columbine St Unit 407
- 1140 Columbine St Unit 406
- 1140 Columbine St Unit 405
- 1140 Columbine St Unit 404
- 1140 Columbine St Unit 403
- 1140 Columbine St Unit 401
- 1140 Columbine St Unit 305
- 1140 Columbine St
- 1140 Columbine St Unit 303
- 1140 Columbine St
- 1140 Columbine St Unit 205
- 1140 Columbine St
- 1140 Columbine St Unit 203
- 1140 Columbine St Unit 202
- 1140 Columbine St Unit 107
- 1140 Columbine St Unit 106
- 1140 Columbine St Unit 104
- 1140 Columbine St Unit 103
- 1140 Columbine St Unit 102
- 1140 Columbine St Unit 101