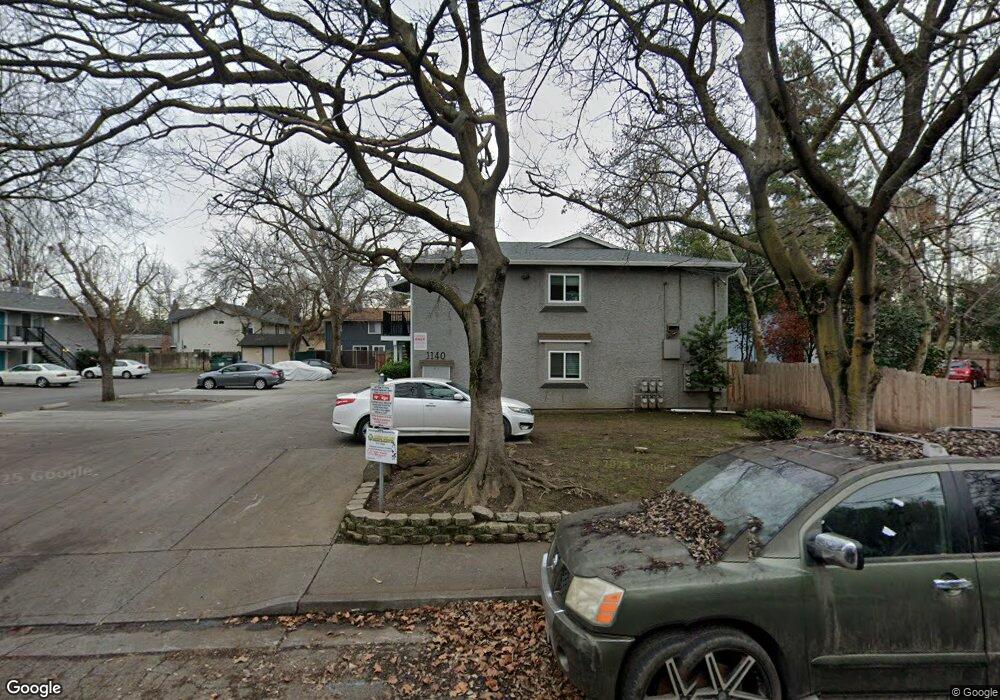
1140 N Cedar St Unit 1 Chico, CA 95926
Chico Vecino NeighborhoodEstimated Value: $185,000 - $552,590
4
Beds
2
Baths
1,166
Sq Ft
$266/Sq Ft
Est. Value
About This Home
This home is located at 1140 N Cedar St Unit 1, Chico, CA 95926 and is currently estimated at $309,898, approximately $265 per square foot. 1140 N Cedar St Unit 1 is a home located in Butte County with nearby schools including Citrus Avenue Elementary School, Chico Junior High School, and Chico High School.
Ownership History
Date
Name
Owned For
Owner Type
Purchase Details
Closed on
Apr 22, 2021
Sold by
Rehe Donald G and Tolentino Rehe Grace
Bought by
Osm Investment Company
Current Estimated Value
Home Financials for this Owner
Home Financials are based on the most recent Mortgage that was taken out on this home.
Original Mortgage
$1,600,000
Outstanding Balance
$1,439,920
Interest Rate
2.8%
Mortgage Type
New Conventional
Estimated Equity
-$1,130,022
Purchase Details
Closed on
Mar 30, 2021
Sold by
Osm Investment Company
Bought by
Osm Investment Company
Home Financials for this Owner
Home Financials are based on the most recent Mortgage that was taken out on this home.
Original Mortgage
$1,600,000
Outstanding Balance
$1,439,920
Interest Rate
2.8%
Mortgage Type
New Conventional
Estimated Equity
-$1,130,022
Purchase Details
Closed on
Jun 21, 2019
Sold by
Lee Ken and Chiang Charlie
Bought by
Osm Investment Company
Purchase Details
Closed on
Jan 5, 2013
Sold by
Lee Ken
Bought by
Lin Ray
Create a Home Valuation Report for This Property
The Home Valuation Report is an in-depth analysis detailing your home's value as well as a comparison with similar homes in the area
Home Values in the Area
Average Home Value in this Area
Purchase History
| Date | Buyer | Sale Price | Title Company |
|---|---|---|---|
| Osm Investment Company | -- | Timios Title A Ca Corp | |
| Osm Investment Company | -- | Timios | |
| Osm Investment Company | $462,500 | Timios Title | |
| Lin Ray | -- | None Available |
Source: Public Records
Mortgage History
| Date | Status | Borrower | Loan Amount |
|---|---|---|---|
| Open | Osm Investment Company | $1,600,000 |
Source: Public Records
Tax History Compared to Growth
Tax History
| Year | Tax Paid | Tax Assessment Tax Assessment Total Assessment is a certain percentage of the fair market value that is determined by local assessors to be the total taxable value of land and additions on the property. | Land | Improvement |
|---|---|---|---|---|
| 2025 | $1,835 | $168,598 | $49,212 | $119,386 |
| 2024 | $1,835 | $165,294 | $48,248 | $117,046 |
| 2023 | $1,814 | $162,053 | $47,302 | $114,751 |
| 2022 | $1,785 | $158,876 | $46,375 | $112,501 |
| 2021 | $1,751 | $155,762 | $45,466 | $110,296 |
| 2020 | $1,746 | $154,166 | $45,000 | $109,166 |
| 2019 | $1,486 | $130,869 | $40,830 | $90,039 |
| 2018 | $1,459 | $128,304 | $40,030 | $88,274 |
| 2017 | $1,438 | $125,790 | $39,246 | $86,544 |
| 2016 | $1,313 | $123,325 | $38,477 | $84,848 |
| 2015 | $1,084 | $100,000 | $25,000 | $75,000 |
| 2014 | $814 | $75,000 | $33,333 | $41,667 |
Source: Public Records
Map
Nearby Homes
- 810 W 1st Ave
- 703 W 2nd Ave
- 1114 Nord Ave Unit 8
- 1114 Nord Ave Unit 11
- 1114 Nord Ave Unit 17
- 642 W 1st Ave
- 1412 N Cherry St Unit 9
- 1528 Bidwell Dr
- 1397 Nord Ave
- 1395 Nord Ave
- 23 Carriage Ln
- 345 W 1st Ave
- 115 Hampshire Dr
- 325 W 1st Ave
- 1122 Stewart Ave
- 1036 Gateway Ln
- 1131 Stewart Ave
- 234 W 3rd Ave
- 1220 Bidwell Ave
- 202 W 2nd Ave
- 1140 N Cedar St Unit 2
- 1140 N Cedar St Unit 5
- 1140 N Cedar St
- 1140 N Cedar St Unit 6
- 1140 N Cedar St Unit 3
- 1140 N Cedar St Unit 4
- 1126 N Cedar St
- 1146 N Cedar St
- 811 W 2nd Ave
- 849 W 2nd Ave
- 1120 N Cedar St
- 841 W 2nd Ave
- 837 W 2nd Ave
- 1143 N Cedar St
- 1143 N Cedar St
- 827 W 2nd Ave
- 1127 N Cedar St
- 1121 N Cedar St
- 1110 N Cedar St
- 803 W 2nd Ave