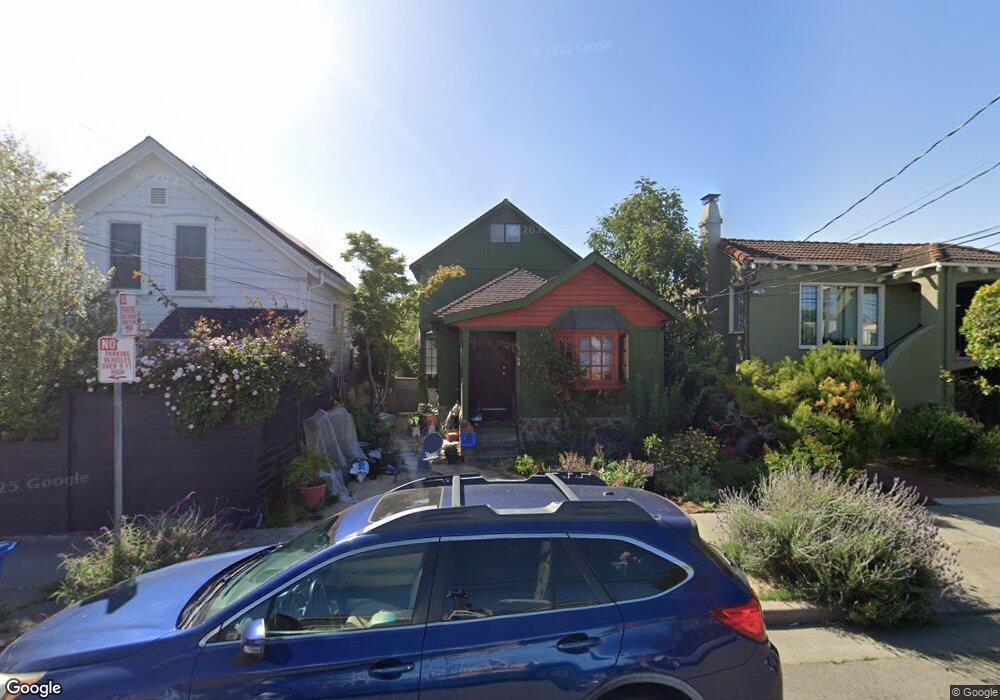
1140 Peach St Alameda, CA 94501
South Shore NeighborhoodEstimated Value: $1,267,000 - $1,381,000
4
Beds
2
Baths
1,533
Sq Ft
$859/Sq Ft
Est. Value
About This Home
This home is located at 1140 Peach St, Alameda, CA 94501 and is currently estimated at $1,317,117, approximately $859 per square foot. 1140 Peach St is a home located in Alameda County with nearby schools including Frank Otis Elementary School, Lincoln Middle School, and Alameda High School.
Ownership History
Date
Name
Owned For
Owner Type
Purchase Details
Closed on
Dec 7, 2016
Sold by
Trenev Stefan G and Trenev Johanna
Bought by
Collins Matthew and Breunig Emily
Current Estimated Value
Home Financials for this Owner
Home Financials are based on the most recent Mortgage that was taken out on this home.
Original Mortgage
$660,000
Outstanding Balance
$533,267
Interest Rate
3.54%
Mortgage Type
New Conventional
Estimated Equity
$783,850
Create a Home Valuation Report for This Property
The Home Valuation Report is an in-depth analysis detailing your home's value as well as a comparison with similar homes in the area
Home Values in the Area
Average Home Value in this Area
Purchase History
| Date | Buyer | Sale Price | Title Company |
|---|---|---|---|
| Collins Matthew | $825,000 | Chicago Title Company |
Source: Public Records
Mortgage History
| Date | Status | Borrower | Loan Amount |
|---|---|---|---|
| Open | Collins Matthew | $660,000 |
Source: Public Records
Tax History
| Year | Tax Paid | Tax Assessment Tax Assessment Total Assessment is a certain percentage of the fair market value that is determined by local assessors to be the total taxable value of land and additions on the property. | Land | Improvement |
|---|---|---|---|---|
| 2025 | $13,452 | $957,461 | $382,984 | $574,477 |
| 2024 | $13,452 | $938,692 | $375,477 | $563,215 |
| 2023 | $12,927 | $920,287 | $368,115 | $552,172 |
| 2022 | $12,635 | $902,243 | $360,897 | $541,346 |
| 2021 | $12,318 | $884,556 | $353,822 | $530,734 |
| 2020 | $12,167 | $875,490 | $350,196 | $525,294 |
| 2019 | $11,643 | $858,330 | $343,332 | $514,998 |
| 2018 | $11,347 | $841,500 | $336,600 | $504,900 |
| 2017 | $10,812 | $825,000 | $330,000 | $495,000 |
| 2016 | $2,908 | $131,970 | $72,990 | $58,980 |
| 2015 | $2,891 | $129,988 | $71,894 | $58,094 |
| 2014 | $2,803 | $127,443 | $70,486 | $56,957 |
Source: Public Records
Map
Nearby Homes
- 3208 Washington St
- 3248 Briggs Ave
- 3241 Briggs Ave
- 3002 San Jose Ave
- 3239 Briggs Ave
- 3287 Briggs Ave
- 3277 Sterling Ave
- 3315 Central Ave
- 1324 Grove St
- 1125 Versailles Ave
- 3246 Garfield Ave
- 2713 Calhoun St
- 2843 Central Ave
- 1376 Versailles Ave
- 1321 Pearl St
- 608 Centre Ct
- 641 Centre Ct
- 405 Centre Ct
- 632 Centre Ct Unit 48
- 2608 Central Ave
- 1142 Peach St
- 1138 Peach St
- 1134 Peach St
- 3256 San Jose Ave
- 1128 Peach St
- 3258 San Jose Ave
- 3257 Adams St
- 1147 Peach St
- 3243 San Jose Ave
- 3243 Adams St
- 3262 San Jose Ave
- 3261 Adams St
- 3238 San Jose Ave
- 1204 Peach St
- 1135 Peach St
- 3255 San Jose Ave
- 3265 Adams St
- 1127 Peach St
- 3264 San Jose Ave
- 3236 San Jose Ave
Your Personal Tour Guide
Ask me questions while you tour the home.