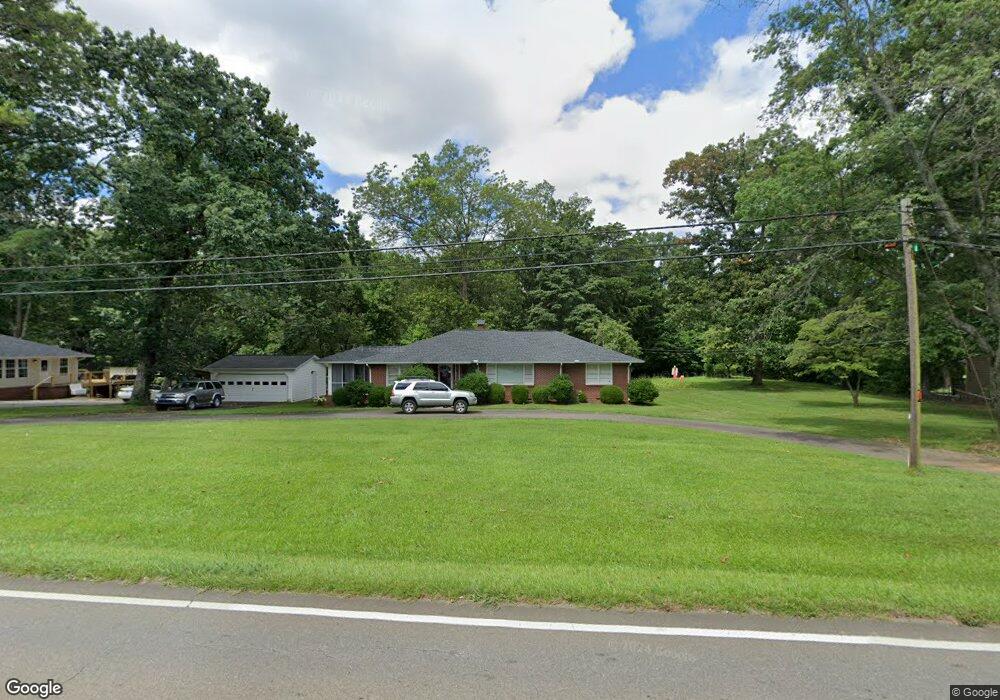
1140 S Main St Jasper, GA 30143
Estimated Value: $323,000 - $375,628
4
Beds
2
Baths
1,824
Sq Ft
$189/Sq Ft
Est. Value
About This Home
This home is located at 1140 S Main St, Jasper, GA 30143 and is currently estimated at $345,157, approximately $189 per square foot. 1140 S Main St is a home located in Pickens County with nearby schools including Harmony Elementary School, Pickens County Middle School, and Pickens County High School.
Ownership History
Date
Name
Owned For
Owner Type
Purchase Details
Closed on
Oct 20, 2014
Sold by
Goodrum Deborah A
Bought by
Goss Robert and Goss Rebekah
Current Estimated Value
Home Financials for this Owner
Home Financials are based on the most recent Mortgage that was taken out on this home.
Original Mortgage
$138,200
Outstanding Balance
$105,778
Interest Rate
4.29%
Mortgage Type
New Conventional
Estimated Equity
$239,379
Purchase Details
Closed on
Feb 9, 2000
Sold by
Logan William S
Bought by
Goodrum Deborah A
Purchase Details
Closed on
May 20, 1999
Sold by
Foster Ronald W
Bought by
Logan William S
Purchase Details
Closed on
Apr 6, 1999
Sold by
Astoria Perferred Funding Corp
Bought by
Federal National Mortgage
Purchase Details
Closed on
Aug 1, 1994
Sold by
Harris Gladys B
Bought by
Foster Ronald W and Foster Nancy B
Purchase Details
Closed on
Apr 1, 1979
Bought by
Harris Gladys B
Create a Home Valuation Report for This Property
The Home Valuation Report is an in-depth analysis detailing your home's value as well as a comparison with similar homes in the area
Home Values in the Area
Average Home Value in this Area
Purchase History
| Date | Buyer | Sale Price | Title Company |
|---|---|---|---|
| Goss Robert | $138,200 | -- | |
| Goodrum Deborah A | $123,000 | -- | |
| Logan William S | $99,000 | -- | |
| Federal National Mortgage | -- | -- | |
| Astoria Perferred Funding Corp | -- | -- | |
| Foster Ronald W | $75,000 | -- | |
| Harris Gladys B | -- | -- |
Source: Public Records
Mortgage History
| Date | Status | Borrower | Loan Amount |
|---|---|---|---|
| Open | Goss Robert | $138,200 |
Source: Public Records
Tax History
| Year | Tax Paid | Tax Assessment Tax Assessment Total Assessment is a certain percentage of the fair market value that is determined by local assessors to be the total taxable value of land and additions on the property. | Land | Improvement |
|---|---|---|---|---|
| 2025 | $1,890 | $109,373 | $22,000 | $87,373 |
| 2024 | $1,968 | $104,457 | $22,000 | $82,457 |
| 2023 | $2,023 | $104,457 | $22,000 | $82,457 |
| 2022 | $1,465 | $77,028 | $22,000 | $55,028 |
| 2021 | $1,341 | $66,536 | $11,508 | $55,028 |
| 2020 | $1,137 | $55,657 | $11,508 | $44,149 |
| 2019 | $1,163 | $55,657 | $11,508 | $44,149 |
| 2018 | $1,174 | $55,657 | $11,508 | $44,149 |
| 2017 | $1,193 | $55,657 | $11,508 | $44,149 |
| 2016 | $1,200 | $55,148 | $11,508 | $43,640 |
| 2015 | $1,172 | $55,148 | $11,508 | $43,640 |
| 2014 | $1,161 | $49,589 | $11,508 | $38,081 |
| 2013 | -- | $49,589 | $11,508 | $38,081 |
Source: Public Records
Map
Nearby Homes
- 51 Griffith Ave
- 232 Happy Trails Way
- 84 Rackley Rd
- 275 Beth Ave
- 450 Griffith Ave
- 597 S Main St
- 0 Hickory Trail Unit 405391
- 0 Hickory Trail Unit 10593185
- 8266 Cox Mountain Dr
- 5 Towne Villas Dr
- 28 Sandstone Dr
- 24 N Rim Dr
- 190 Towne Villas Dr
- 57 Towne Club Dr
- 41 Towne Club Dr
- 348 Old Tate Rd
- 64 Brittany Ct Unit 15
- 80 Jones St
- 30 Brittany Ct Unit 20
- 244 Town Creek Trail
- 1168 S Main St
- 1110 S Main St
- 60 Lanier Ave
- 79 Griffith Ave
- 1200 S Main St
- 1050 S Main St
- 285 Wildlife Ridge Rd
- 236 Wildlife Ridge Rd
- 289 Wildlife Ridge Rd
- 109 Griffith Ave
- 100 Griffith Ave
- 1211 S Main St
- 126 Lanier Ave
- 1242 S Main St
- 91 Lanier Ave
- 56 Charles Ave
- 1165 S Main St
- 16 Montview Dr
- 135 Lanier Ave
- 145 Griffith Ave
Your Personal Tour Guide
Ask me questions while you tour the home.