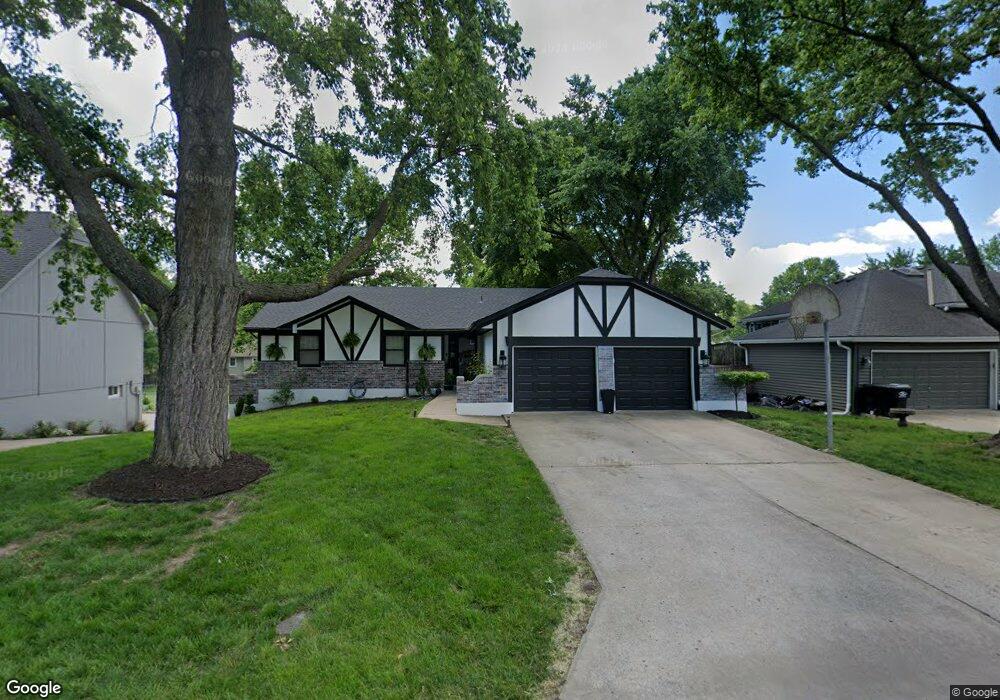
11403 E 57th Terrace Raytown, MO 64133
Estimated Value: $222,000 - $288,000
4
Beds
3
Baths
1,686
Sq Ft
$151/Sq Ft
Est. Value
About This Home
This home is located at 11403 E 57th Terrace, Raytown, MO 64133 and is currently estimated at $254,696, approximately $151 per square foot. 11403 E 57th Terrace is a home located in Jackson County with nearby schools including Fleetridge Elementary School, Raytown Middle School, and Raytown South High School.
Ownership History
Date
Name
Owned For
Owner Type
Purchase Details
Closed on
Jul 16, 2008
Sold by
Us Bank Na
Bought by
Wilson Roxanne N and Duncan John
Current Estimated Value
Home Financials for this Owner
Home Financials are based on the most recent Mortgage that was taken out on this home.
Original Mortgage
$128,622
Interest Rate
6.57%
Mortgage Type
FHA
Purchase Details
Closed on
Jan 2, 2008
Sold by
Donahue Brian
Bought by
Us Bank Na and Mlmi Surf Trust Series 2006-Bc3
Purchase Details
Closed on
Mar 14, 2006
Sold by
Jordan Nathan L and Jordan Debra S
Bought by
Donahue Brian
Home Financials for this Owner
Home Financials are based on the most recent Mortgage that was taken out on this home.
Original Mortgage
$139,920
Interest Rate
8.75%
Mortgage Type
Fannie Mae Freddie Mac
Create a Home Valuation Report for This Property
The Home Valuation Report is an in-depth analysis detailing your home's value as well as a comparison with similar homes in the area
Home Values in the Area
Average Home Value in this Area
Purchase History
| Date | Buyer | Sale Price | Title Company |
|---|---|---|---|
| Wilson Roxanne N | -- | Mo Kan Title Services Inc | |
| Us Bank Na | $87,500 | None Available | |
| Donahue Brian | -- | Nations Title Agency Inc |
Source: Public Records
Mortgage History
| Date | Status | Borrower | Loan Amount |
|---|---|---|---|
| Previous Owner | Wilson Roxanne N | $128,622 | |
| Previous Owner | Donahue Brian | $139,920 |
Source: Public Records
Tax History
| Year | Tax Paid | Tax Assessment Tax Assessment Total Assessment is a certain percentage of the fair market value that is determined by local assessors to be the total taxable value of land and additions on the property. | Land | Improvement |
|---|---|---|---|---|
| 2025 | $1,057 | $13,477 | $6,162 | $7,315 |
| 2024 | $1,050 | $11,719 | $1,560 | $10,159 |
| 2023 | $1,050 | $11,719 | $1,066 | $10,653 |
| 2022 | $3,306 | $35,150 | $7,257 | $27,893 |
| 2021 | $3,318 | $35,150 | $7,257 | $27,893 |
| 2020 | $3,048 | $31,987 | $7,257 | $24,730 |
| 2019 | $3,032 | $31,987 | $7,257 | $24,730 |
| 2018 | $2,548 | $27,839 | $6,316 | $21,523 |
| 2017 | $2,548 | $27,839 | $6,316 | $21,523 |
| 2016 | $2,299 | $25,265 | $2,740 | $22,525 |
Source: Public Records
Map
Nearby Homes
- 5608 Woodson Rd
- 5813 Harvard Ave
- 5933 Sterling Ave
- 10905 E 59th St
- 12000 E 56th Terrace
- 6100 Englewood Ave
- 11213 E 61st St
- 5425 Appleton Ave
- 10909 E 60th Terrace
- 11013 E 53rd Terrace
- 5305 Ridgeway Ave
- 11601 E 62nd St
- 6215 Sterling Ave
- 5433 Willow Ave
- 12124 E 54th St
- 5821 Marion Ave
- 6207 Hedges Ave
- 6121 Willow Ave
- 5117 Woodson Rd
- 6322 Norwood Ct
- 11319 E 57th Terrace
- 11407 E 57th Terrace
- 11315 E 57th Terrace
- 11413 E 57th Terrace
- 11400 E 58th St
- 11400 E 57th Terrace
- 11320 E 57th Terrace
- 11311 E 57th Terrace
- 11406 E 57th Terrace
- 11312 E 58th St
- 11316 E 58th St
- 11316 E 57th Terrace
- 11419 E 57th Terrace
- 11416 E 57th Terrace
- 11412 E 58th St
- 11312 E 57th Terrace
- 11307 E 57th Terrace
- 11420 E 57th Terrace
- 11418 E 58th St
- 11401 E 58th St
Your Personal Tour Guide
Ask me questions while you tour the home.