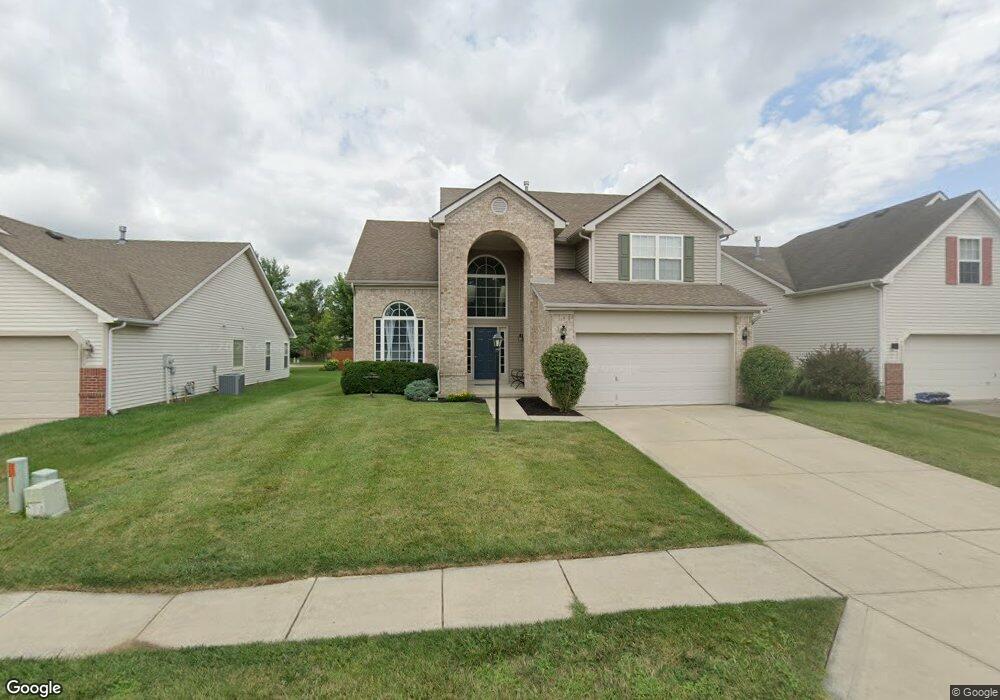
11405 Apalachian Way Fishers, IN 46037
Estimated Value: $356,000 - $387,000
3
Beds
3
Baths
2,780
Sq Ft
$134/Sq Ft
Est. Value
About This Home
This home is located at 11405 Apalachian Way, Fishers, IN 46037 and is currently estimated at $372,023, approximately $133 per square foot. 11405 Apalachian Way is a home located in Hamilton County with nearby schools including Fall Creek Elementary School, Fall Creek Intermediate School, and Sioux Center High School.
Ownership History
Date
Name
Owned For
Owner Type
Purchase Details
Closed on
Oct 7, 2022
Sold by
Shih Wen Shen and Cai Yi
Bought by
Turner Brandon
Current Estimated Value
Home Financials for this Owner
Home Financials are based on the most recent Mortgage that was taken out on this home.
Original Mortgage
$293,250
Outstanding Balance
$281,429
Interest Rate
5.66%
Mortgage Type
New Conventional
Estimated Equity
$90,594
Purchase Details
Closed on
Jun 27, 2005
Sold by
Anicka Michael
Bought by
Shih Wen Shen and Guan Cai Yi
Home Financials for this Owner
Home Financials are based on the most recent Mortgage that was taken out on this home.
Original Mortgage
$120,000
Interest Rate
5.75%
Mortgage Type
Fannie Mae Freddie Mac
Purchase Details
Closed on
Nov 11, 2002
Sold by
Centex Homes
Bought by
Anicka Michael
Home Financials for this Owner
Home Financials are based on the most recent Mortgage that was taken out on this home.
Original Mortgage
$135,150
Interest Rate
6.08%
Mortgage Type
Purchase Money Mortgage
Create a Home Valuation Report for This Property
The Home Valuation Report is an in-depth analysis detailing your home's value as well as a comparison with similar homes in the area
Home Values in the Area
Average Home Value in this Area
Purchase History
| Date | Buyer | Sale Price | Title Company |
|---|---|---|---|
| Turner Brandon | $345,000 | -- | |
| Shih Wen Shen | -- | Century Title Services | |
| Anicka Michael | -- | Chicago Title North |
Source: Public Records
Mortgage History
| Date | Status | Borrower | Loan Amount |
|---|---|---|---|
| Open | Turner Brandon | $293,250 | |
| Previous Owner | Shih Wen Shen | $120,000 | |
| Previous Owner | Anicka Michael | $135,150 | |
| Closed | Anicka Michael | $25,342 |
Source: Public Records
Tax History Compared to Growth
Tax History
| Year | Tax Paid | Tax Assessment Tax Assessment Total Assessment is a certain percentage of the fair market value that is determined by local assessors to be the total taxable value of land and additions on the property. | Land | Improvement |
|---|---|---|---|---|
| 2024 | $3,141 | $289,600 | $33,100 | $256,500 |
| 2023 | $3,141 | $289,600 | $33,100 | $256,500 |
| 2022 | $2,692 | $236,100 | $33,100 | $203,000 |
| 2021 | $4,476 | $207,800 | $33,100 | $174,700 |
| 2020 | $4,137 | $180,400 | $33,100 | $147,300 |
| 2019 | $4,046 | $175,600 | $30,100 | $145,500 |
| 2018 | $4,920 | $213,500 | $30,100 | $183,400 |
| 2017 | $3,940 | $172,900 | $30,100 | $142,800 |
| 2016 | $3,735 | $164,900 | $30,100 | $134,800 |
| 2014 | $3,353 | $157,100 | $30,100 | $127,000 |
| 2013 | $3,353 | $158,600 | $30,100 | $128,500 |
Source: Public Records
Map
Nearby Homes
- 12430 Hyacinth Dr
- 11517 Moss Rock Ct
- 11502 Hearthstone Dr
- 10990 Brooks School Rd
- 10982 Brooks School Rd
- 11101 Hawthorn Ridge
- 290 Breakwater Dr
- 11318 Talon Trace
- 12864 Hanley Dr
- 11416 Forest Knoll Cir
- 10704 Club Chase
- 11932 Hollyhock Dr
- 11579 Townsend Ct
- 10725 Chase Ct
- 10606 Brooks School Rd
- 10746 Haven Cove Way
- 10725 Crum Ct
- 11346 Talnuck Cir
- 12230 Cobblestone Dr
- 12337 River Valley Dr
- 11405 Apalachian Way
- 11403 Apalachian Way
- 11409 Apalachian Way
- 12615 Adirondack Ct
- 11399 Apalachian Way
- 12625 Adirondack Ct
- 11395 Apalachian Way
- 11395 Appalachian Way
- 11406 Apalachian Way
- 12635 Adirondack Ct
- 11404 Apalachian Way
- 11402 Apalachian Way
- 11408 Apalachian Way
- 11413 Apalachian Way
- 12645 Adirondack Ct
- 11398 Apalachian Way
- 11393 Apalachian Way
- 12584 Adirondack Ct
- 11394 Apalachian Way
- 12594 Adirondack Ct