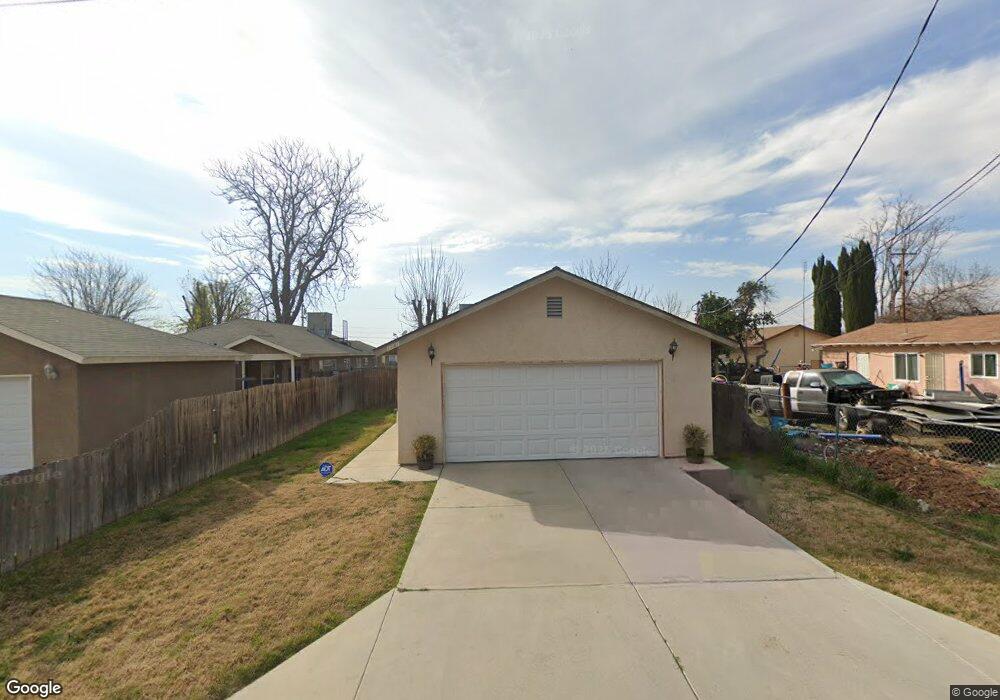
1141 Cagle Ln Shafter, CA 93263
Estimated Value: $198,000 - $330,426
3
Beds
2
Baths
1,667
Sq Ft
$171/Sq Ft
Est. Value
About This Home
This home is located at 1141 Cagle Ln, Shafter, CA 93263 and is currently estimated at $284,857, approximately $170 per square foot. 1141 Cagle Ln is a home located in Kern County with nearby schools including Redwood Elementary School, Golden Oak Elementary School, and Shafter High School.
Ownership History
Date
Name
Owned For
Owner Type
Purchase Details
Closed on
Oct 8, 2009
Sold by
Federal Home Loan Mortgage Corporation
Bought by
Mendoza Jorge Javier and Gastelum Cynthia Osuna
Current Estimated Value
Home Financials for this Owner
Home Financials are based on the most recent Mortgage that was taken out on this home.
Original Mortgage
$94,387
Interest Rate
4.83%
Mortgage Type
New Conventional
Purchase Details
Closed on
Jun 3, 2009
Sold by
Silva David
Bought by
Federal Home Loan Mortgage Corporation
Purchase Details
Closed on
Aug 22, 2007
Sold by
Silva Beckie
Bought by
Silva David
Home Financials for this Owner
Home Financials are based on the most recent Mortgage that was taken out on this home.
Original Mortgage
$192,000
Interest Rate
8.37%
Mortgage Type
New Conventional
Purchase Details
Closed on
Aug 22, 2006
Sold by
Gutierrez Raul and Gutierrez Florencia
Bought by
Silva David and Silva Beckie
Create a Home Valuation Report for This Property
The Home Valuation Report is an in-depth analysis detailing your home's value as well as a comparison with similar homes in the area
Home Values in the Area
Average Home Value in this Area
Purchase History
| Date | Buyer | Sale Price | Title Company |
|---|---|---|---|
| Mendoza Jorge Javier | $92,500 | First American Title Ins Co | |
| Federal Home Loan Mortgage Corporation | $119,775 | First American Title Ins Co | |
| Silva David | -- | Alliance Title Company | |
| Silva David | $42,500 | Stewart Title Of Ca Inc |
Source: Public Records
Mortgage History
| Date | Status | Borrower | Loan Amount |
|---|---|---|---|
| Previous Owner | Mendoza Jorge Javier | $94,387 | |
| Previous Owner | Silva David | $192,000 |
Source: Public Records
Tax History
| Year | Tax Paid | Tax Assessment Tax Assessment Total Assessment is a certain percentage of the fair market value that is determined by local assessors to be the total taxable value of land and additions on the property. | Land | Improvement |
|---|---|---|---|---|
| 2025 | $1,626 | $119,388 | $32,263 | $87,125 |
| 2024 | $1,626 | $117,048 | $31,631 | $85,417 |
| 2023 | $1,575 | $114,754 | $31,011 | $83,743 |
| 2022 | $1,509 | $112,504 | $30,403 | $82,101 |
| 2021 | $1,444 | $110,299 | $29,807 | $80,492 |
| 2020 | $1,401 | $109,169 | $29,502 | $79,667 |
| 2019 | $1,396 | $109,169 | $29,502 | $79,667 |
| 2018 | $1,346 | $104,931 | $28,357 | $76,574 |
| 2017 | $1,336 | $102,874 | $27,801 | $75,073 |
| 2016 | $1,267 | $100,857 | $27,256 | $73,601 |
| 2015 | $1,233 | $99,343 | $26,847 | $72,496 |
| 2014 | $1,188 | $97,398 | $26,322 | $71,076 |
Source: Public Records
Map
Nearby Homes
Your Personal Tour Guide
Ask me questions while you tour the home.