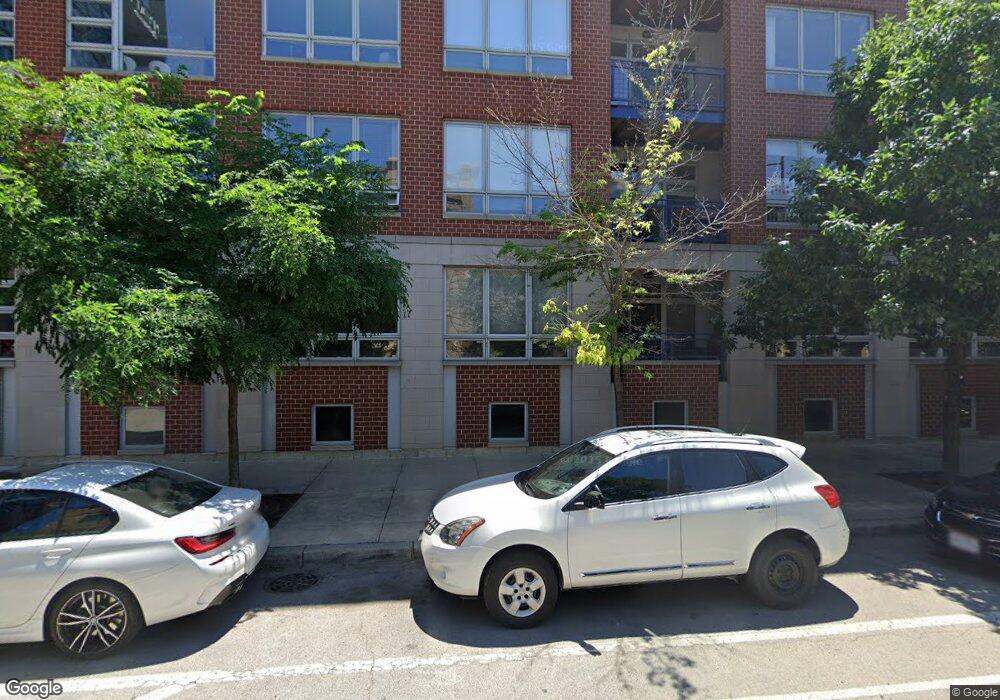
1141 W Washington Blvd Unit 233 Chicago, IL 60607
West Loop NeighborhoodEstimated Value: $558,763 - $1,785,000
--
Bed
--
Bath
--
Sq Ft
1.73
Acres
About This Home
This home is located at 1141 W Washington Blvd Unit 233, Chicago, IL 60607 and is currently estimated at $900,191. 1141 W Washington Blvd Unit 233 is a home located in Cook County with nearby schools including Skinner Elementary School, Wells Community Academy High School, and Montessori Academy Of Chicago.
Ownership History
Date
Name
Owned For
Owner Type
Purchase Details
Closed on
Apr 29, 2024
Sold by
Aeb & T Partnership
Bought by
Berman Leah Elyse
Current Estimated Value
Home Financials for this Owner
Home Financials are based on the most recent Mortgage that was taken out on this home.
Original Mortgage
$364,000
Outstanding Balance
$359,106
Interest Rate
7.1%
Mortgage Type
Seller Take Back
Estimated Equity
$541,085
Purchase Details
Closed on
May 2, 2018
Sold by
Araiza Michael J and Araiza Pamela J
Bought by
Aeb & T Partnership and Leb & T Partnership
Purchase Details
Closed on
Jul 23, 1999
Sold by
Washington Boulevard Llc
Bought by
Araiza Michael J and Araiza Pamela J
Home Financials for this Owner
Home Financials are based on the most recent Mortgage that was taken out on this home.
Original Mortgage
$214,950
Interest Rate
7.9%
Create a Home Valuation Report for This Property
The Home Valuation Report is an in-depth analysis detailing your home's value as well as a comparison with similar homes in the area
Home Values in the Area
Average Home Value in this Area
Purchase History
| Date | Buyer | Sale Price | Title Company |
|---|---|---|---|
| Berman Leah Elyse | $564,000 | None Listed On Document | |
| Berman Leah Elyse | $564,000 | None Listed On Document | |
| Aeb & T Partnership | $625,000 | Greater Illinois Title | |
| Araiza Michael J | $268,500 | -- |
Source: Public Records
Mortgage History
| Date | Status | Borrower | Loan Amount |
|---|---|---|---|
| Open | Berman Leah Elyse | $364,000 | |
| Closed | Berman Leah Elyse | $364,000 | |
| Previous Owner | Araiza Michael J | $214,950 |
Source: Public Records
Tax History Compared to Growth
Tax History
| Year | Tax Paid | Tax Assessment Tax Assessment Total Assessment is a certain percentage of the fair market value that is determined by local assessors to be the total taxable value of land and additions on the property. | Land | Improvement |
|---|---|---|---|---|
| 2024 | $9,075 | $53,356 | $4,393 | $48,963 |
| 2023 | $8,847 | $42,866 | $2,409 | $40,457 |
| 2022 | $8,847 | $42,866 | $2,409 | $40,457 |
| 2021 | $8,648 | $42,865 | $2,409 | $40,456 |
| 2020 | $9,647 | $43,160 | $2,409 | $40,751 |
| 2019 | $9,522 | $47,236 | $2,409 | $44,827 |
| 2018 | $9,361 | $47,236 | $2,409 | $44,827 |
| 2017 | $5,876 | $33,280 | $2,125 | $31,155 |
| 2016 | $6,165 | $33,280 | $2,125 | $31,155 |
| 2015 | $5,618 | $33,280 | $2,125 | $31,155 |
| 2014 | $4,862 | $28,774 | $1,806 | $26,968 |
| 2013 | $4,755 | $28,774 | $1,806 | $26,968 |
Source: Public Records
Map
Nearby Homes
- 6 N May St Unit 403
- 16 N May St Unit 543
- 1141 W Washington Blvd Unit 246
- 21 N May St Unit 305
- 23 N Racine Ave Unit 405
- 18 S Aberdeen St Unit 3
- 1109 W Washington Blvd Unit 7A
- 1109 W Washington Blvd Unit 5C
- 1109 W Washington Blvd Unit 8A
- 1109 W Washington Blvd Unit 6B
- 106 N Aberdeen St Unit 5G
- 36 N Carpenter St Unit 2N
- 18 N Carpenter St Unit PHN
- 1113 W Randolph St
- 116 N Willard Ct Unit 301
- 116 N Willard Ct Unit PH01
- 1016 W Madison St Unit 5N
- 1001 W Madison St Unit 713
- 1001 W Madison St Unit 710
- 1001 W Madison St Unit 213
- 24 N May St Unit 302
- 24 N May St Unit 305
- 24 N May St Unit 304
- 24 N May St Unit 306
- 24 N May St Unit 303
- 24 N May St Unit 301
- 24 N May St Unit 334
- 24 N May St Unit 324
- 24 N May St Unit 323
- 24 N May St Unit 333
- 1141 W Washington Blvd Unit 244
- 1141 W Washington Blvd Unit 236
- 1141 W Washington Blvd Unit 225
- 1141 W Washington Blvd Unit 247
- 1141 W Washington Blvd Unit 227
- 1141 W Washington Blvd Unit 222
- 16 N May St Unit 510
- 1141 W Washington Blvd Unit 235
- 1141 W Washington Blvd Unit 201
- 16 N May St Unit 508