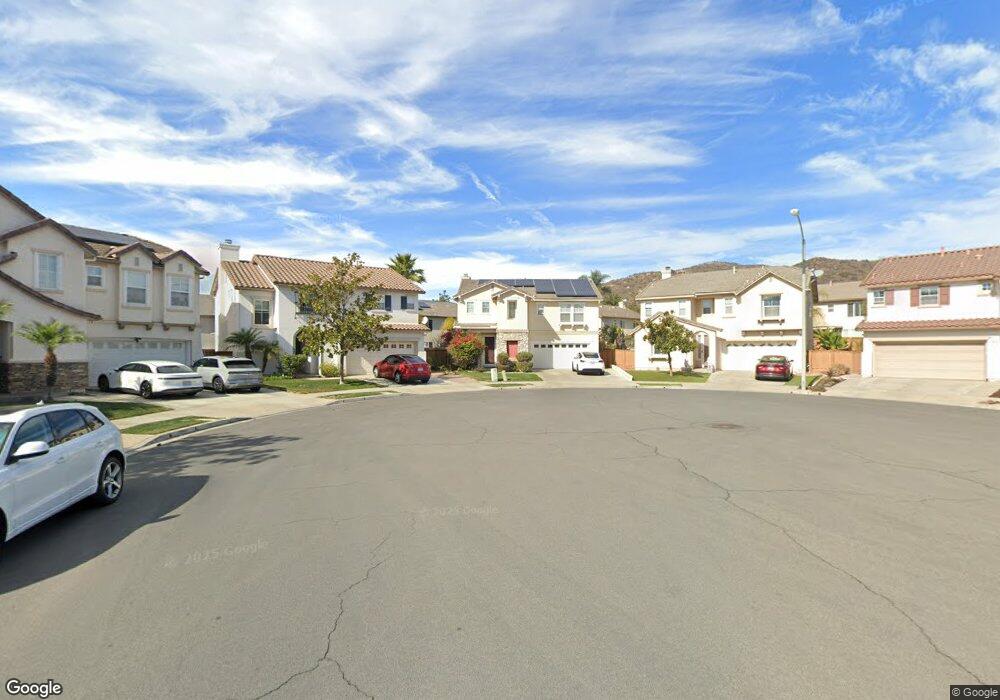
11410 Southbrook Ct San Diego, CA 92128
Estimated Value: $1,455,000 - $1,569,000
4
Beds
3
Baths
2,216
Sq Ft
$686/Sq Ft
Est. Value
About This Home
This home is located at 11410 Southbrook Ct, San Diego, CA 92128 and is currently estimated at $1,520,722, approximately $686 per square foot. 11410 Southbrook Ct is a home located in San Diego County with nearby schools including Creekside Elementary, Meadowbrook Middle, and Mt. Carmel High School.
Ownership History
Date
Name
Owned For
Owner Type
Purchase Details
Closed on
Jul 24, 2017
Sold by
Reiss William A and Reiss Sandy S
Bought by
Reiss William A and Reiss Sandy S
Current Estimated Value
Purchase Details
Closed on
Feb 6, 2006
Sold by
Gose Demy J and Gose Roselyn O
Bought by
Reiss William A and Reiss Sandy S
Home Financials for this Owner
Home Financials are based on the most recent Mortgage that was taken out on this home.
Original Mortgage
$340,000
Outstanding Balance
$189,587
Interest Rate
6.04%
Mortgage Type
Fannie Mae Freddie Mac
Estimated Equity
$1,331,135
Purchase Details
Closed on
Aug 9, 2000
Sold by
Pardee Construction Company
Bought by
Gose Demy J and Gose Roselyn O
Home Financials for this Owner
Home Financials are based on the most recent Mortgage that was taken out on this home.
Original Mortgage
$265,000
Interest Rate
7.66%
Mortgage Type
Balloon
Create a Home Valuation Report for This Property
The Home Valuation Report is an in-depth analysis detailing your home's value as well as a comparison with similar homes in the area
Home Values in the Area
Average Home Value in this Area
Purchase History
| Date | Buyer | Sale Price | Title Company |
|---|---|---|---|
| Reiss William A | -- | None Available | |
| Reiss William A | $725,000 | First American Title | |
| Gose Demy J | $381,000 | First American Title Ins Co |
Source: Public Records
Mortgage History
| Date | Status | Borrower | Loan Amount |
|---|---|---|---|
| Open | Reiss William A | $340,000 | |
| Previous Owner | Gose Demy J | $265,000 | |
| Closed | Gose Demy J | $77,600 |
Source: Public Records
Tax History Compared to Growth
Tax History
| Year | Tax Paid | Tax Assessment Tax Assessment Total Assessment is a certain percentage of the fair market value that is determined by local assessors to be the total taxable value of land and additions on the property. | Land | Improvement |
|---|---|---|---|---|
| 2025 | $10,304 | $990,711 | $498,772 | $491,939 |
| 2024 | $10,304 | $971,287 | $488,993 | $482,294 |
| 2023 | $10,080 | $952,243 | $479,405 | $472,838 |
| 2022 | $9,927 | $933,572 | $470,005 | $463,567 |
| 2021 | $9,743 | $915,268 | $460,790 | $454,478 |
| 2020 | $9,639 | $905,884 | $456,066 | $449,818 |
| 2019 | $10,276 | $888,123 | $447,124 | $440,999 |
| 2018 | $9,998 | $870,709 | $438,357 | $432,352 |
| 2017 | $8,709 | $750,000 | $376,000 | $374,000 |
| 2016 | $8,704 | $750,000 | $376,000 | $374,000 |
| 2015 | $8,284 | $710,000 | $356,000 | $354,000 |
| 2014 | $8,046 | $685,000 | $344,000 | $341,000 |
Source: Public Records
Map
Nearby Homes
- 12676 Springbrook Dr Unit B
- 12662 Springbrook Dr Unit D
- 12670 Springbrook Dr Unit D
- 11553 Trailbrook Ln Unit 2
- 12626 Springbrook Dr Unit A
- 11590 Trailbrook Ln
- 11466 Tree Hollow Ln
- 12490 Heatherton Ct Unit 8
- 11121 Catarina Ln Unit 73
- 12665 Creekview Dr Unit 140
- 10978 Serafina Ln Unit 69
- 10804 Serafina Ln Unit 6
- 11964 Ashley Place
- 10914 Ivy Hill Dr Unit 1
- 0 Dorathea Terrace
- 10818 Caminito Arcada
- 13015 Evening Creek Dr S Unit 18
- 13009 Evening Creek Dr S Unit 8
- 13039 Evening Creek Dr S Unit 36
- 13048 Wimberly Square Unit 29
- 11416 Southbrook Ct
- 11404 Southbrook Ct
- 11345 Creekstone Ln
- 11361 Creekstone Ln
- 11405 Creekstone Ln
- 11337 Creekstone Ln
- 11422 Southbrook Ct
- 11411 Creekstone Ln
- 11369 Creekstone Ln
- 11403 Southbrook Ct
- 11417 Creekstone Ln
- 11329 Creekstone Ln
- 11428 Southbrook Ct
- 11409 Southbrook Ct
- 11423 Creekstone Ln
- 11321 Creekstone Ln
- 11350 Creekstone Ln
- 11434 Southbrook Ct
- 11358 Creekstone Ln
- 11415 Southbrook Ct