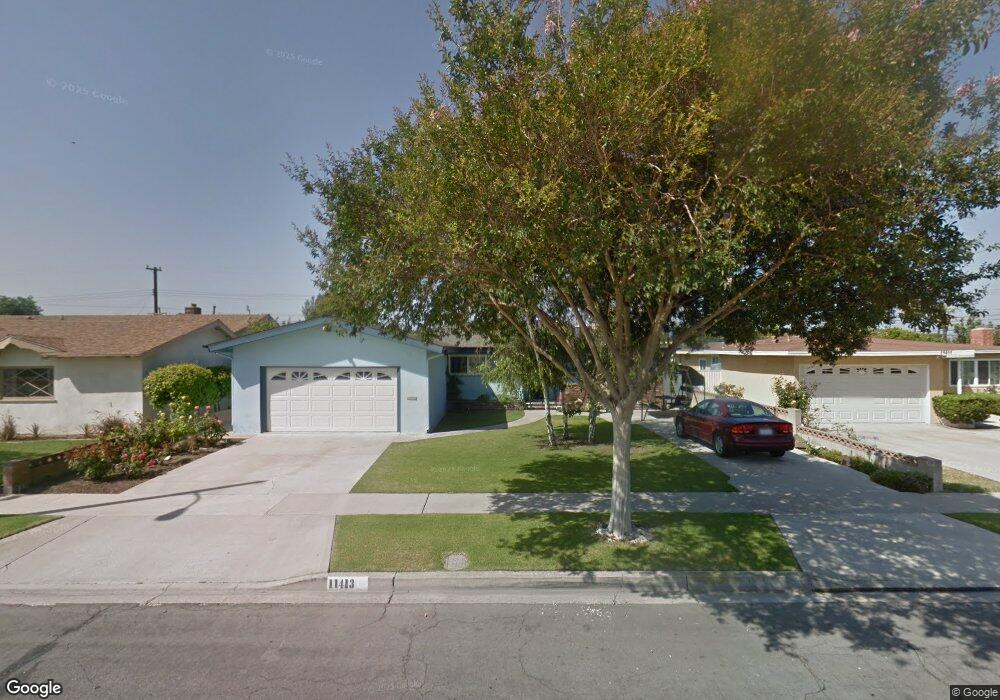
11413 Bowles Ave Garden Grove, CA 92841
Estimated Value: $929,000 - $1,120,000
3
Beds
2
Baths
2,037
Sq Ft
$498/Sq Ft
Est. Value
About This Home
This home is located at 11413 Bowles Ave, Garden Grove, CA 92841 and is currently estimated at $1,014,394, approximately $497 per square foot. 11413 Bowles Ave is a home located in Orange County with nearby schools including Bryant Elementary School, Alamitos Intermediate School, and Rancho Alamitos High School.
Ownership History
Date
Name
Owned For
Owner Type
Purchase Details
Closed on
Jun 17, 2021
Sold by
Grove Garden and Chamberlain Family Trust
Bought by
Hadas Robin and Hadas Alyssa
Current Estimated Value
Home Financials for this Owner
Home Financials are based on the most recent Mortgage that was taken out on this home.
Original Mortgage
$585,000
Outstanding Balance
$529,645
Interest Rate
2.9%
Mortgage Type
New Conventional
Estimated Equity
$484,749
Purchase Details
Closed on
Jan 22, 2018
Sold by
Chamberlain Nancy O
Bought by
Chamberlain Nancy O and The Chamberlain Family Trust
Home Financials for this Owner
Home Financials are based on the most recent Mortgage that was taken out on this home.
Original Mortgage
$100,000
Interest Rate
3.93%
Mortgage Type
Credit Line Revolving
Purchase Details
Closed on
Nov 3, 1993
Sold by
Chamberlain John D and Chamberlain Nancy O
Bought by
Chamberlain John D and Chamberlain Nancy O
Create a Home Valuation Report for This Property
The Home Valuation Report is an in-depth analysis detailing your home's value as well as a comparison with similar homes in the area
Home Values in the Area
Average Home Value in this Area
Purchase History
| Date | Buyer | Sale Price | Title Company |
|---|---|---|---|
| Hadas Robin | $650,000 | Ticor Title Company | |
| Chamberlain Nancy O | -- | First American Title Co | |
| Chamberlain John D | -- | -- |
Source: Public Records
Mortgage History
| Date | Status | Borrower | Loan Amount |
|---|---|---|---|
| Open | Hadas Robin | $585,000 | |
| Previous Owner | Chamberlain Nancy O | $100,000 |
Source: Public Records
Tax History Compared to Growth
Tax History
| Year | Tax Paid | Tax Assessment Tax Assessment Total Assessment is a certain percentage of the fair market value that is determined by local assessors to be the total taxable value of land and additions on the property. | Land | Improvement |
|---|---|---|---|---|
| 2025 | $9,530 | $795,906 | $655,528 | $140,378 |
| 2024 | $9,530 | $780,300 | $642,674 | $137,626 |
| 2023 | $9,355 | $765,000 | $630,072 | $134,928 |
| 2022 | $9,219 | $750,000 | $617,717 | $132,283 |
| 2021 | $1,483 | $90,856 | $26,938 | $63,918 |
| 2020 | $1,467 | $89,925 | $26,662 | $63,263 |
| 2019 | $1,439 | $88,162 | $26,139 | $62,023 |
| 2018 | $1,334 | $86,434 | $25,627 | $60,807 |
| 2017 | $1,315 | $84,740 | $25,125 | $59,615 |
| 2016 | $1,261 | $83,079 | $24,632 | $58,447 |
| 2015 | $1,243 | $81,832 | $24,262 | $57,570 |
| 2014 | $1,204 | $80,230 | $23,787 | $56,443 |
Source: Public Records
Map
Nearby Homes
- 11251 Bowles Ave
- 11222 Magnolia St
- 9041 Shelley Dr
- 11691 Faun Ln
- 8952 Poinsettia Ln
- 11172 Homeway Dr
- 9262 Joyzelle Dr
- 11841 Magnolia St
- 8532 Adah St
- 11432 Pollard Dr
- 8681 Katella Ave
- 8681 Katella Ave Unit 914
- 8681 Katella Ave Unit 861
- 9041 Stacie Ln Unit 12
- 10800 Dale Ave Unit 129
- 10800 Dale Ave Unit 705
- 90093 Stacie Ln
- 12101 Dale Ave Unit 69
- 12101 Dale Ave Unit 44
- 11791 Nearing Dr
- 11411 Bowles Ave
- 11417 Bowles Ave
- 11401 Bowles Ave
- 11421 Bowles Ave
- 8861 Tracy Ave
- 8825 Orangewood Ave
- 11431 Bowles Ave
- 11391 Bowles Ave
- 11402 Bowles Ave
- 8892 Tracy Ave
- 8871 Tracy Ave
- 8821 Orangewood Ave
- 8811 Orangewood Ave
- 11381 Bowles Ave
- 11441 Bowles Ave
- 11382 Bowles Ave
- 8841 Orangewood Ave
- 11442 Bowles Ave
- 8881 Tracy Ave
- 8902 Tracy Ave