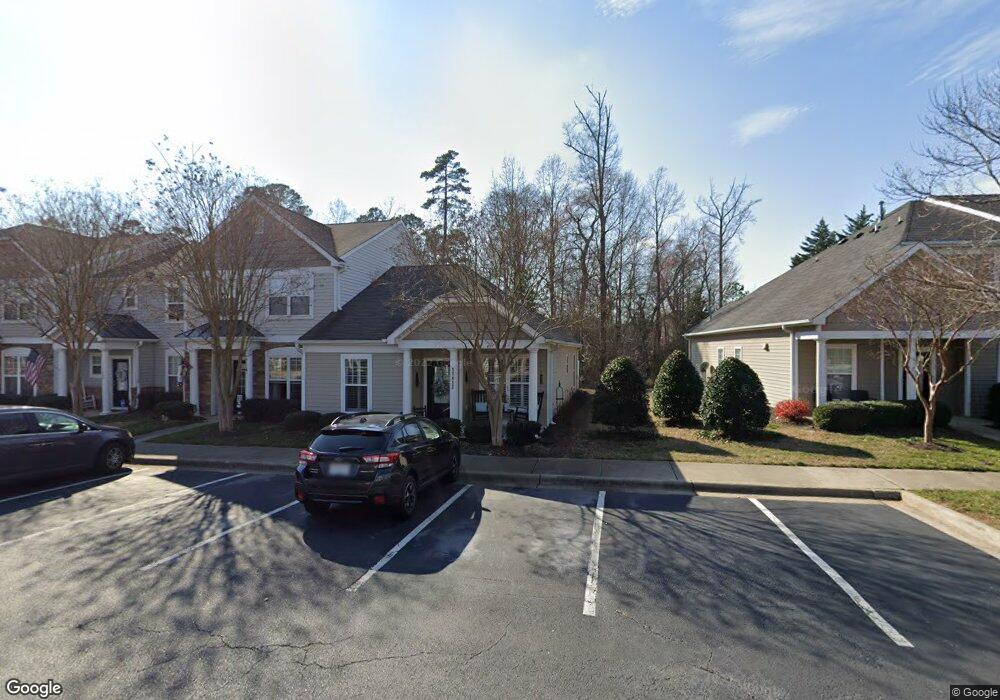
11413 Shadow Elms Ln Raleigh, NC 27614
Falls River NeighborhoodEstimated Value: $290,000 - $320,000
2
Beds
2
Baths
1,122
Sq Ft
$274/Sq Ft
Est. Value
About This Home
This home is located at 11413 Shadow Elms Ln, Raleigh, NC 27614 and is currently estimated at $307,731, approximately $274 per square foot. 11413 Shadow Elms Ln is a home located in Wake County with nearby schools including Abbotts Creek Elementary School, Wakefield Middle, and Wakefield High School.
Ownership History
Date
Name
Owned For
Owner Type
Purchase Details
Closed on
Mar 26, 2019
Sold by
Fowler Susan Jill
Bought by
Fowler Susan Jill and Carter Thomas Grant
Current Estimated Value
Home Financials for this Owner
Home Financials are based on the most recent Mortgage that was taken out on this home.
Original Mortgage
$125,000
Outstanding Balance
$109,672
Interest Rate
4.3%
Mortgage Type
New Conventional
Estimated Equity
$198,059
Purchase Details
Closed on
Mar 6, 2015
Sold by
George James F and George Annette
Bought by
Carter Robert W and Fowler Susan Jill
Home Financials for this Owner
Home Financials are based on the most recent Mortgage that was taken out on this home.
Original Mortgage
$96,100
Interest Rate
3.74%
Mortgage Type
New Conventional
Purchase Details
Closed on
Feb 2, 2015
Sold by
D R Horton Inc
Bought by
George James Francis and George Annette
Home Financials for this Owner
Home Financials are based on the most recent Mortgage that was taken out on this home.
Original Mortgage
$96,100
Interest Rate
3.74%
Mortgage Type
New Conventional
Create a Home Valuation Report for This Property
The Home Valuation Report is an in-depth analysis detailing your home's value as well as a comparison with similar homes in the area
Home Values in the Area
Average Home Value in this Area
Purchase History
| Date | Buyer | Sale Price | Title Company |
|---|---|---|---|
| Fowler Susan Jill | -- | None Available | |
| Carter Robert W | $158,500 | None Available | |
| George James Francis | -- | None Available |
Source: Public Records
Mortgage History
| Date | Status | Borrower | Loan Amount |
|---|---|---|---|
| Open | Fowler Susan Jill | $125,000 | |
| Closed | Carter Robert W | $96,100 |
Source: Public Records
Tax History Compared to Growth
Tax History
| Year | Tax Paid | Tax Assessment Tax Assessment Total Assessment is a certain percentage of the fair market value that is determined by local assessors to be the total taxable value of land and additions on the property. | Land | Improvement |
|---|---|---|---|---|
| 2025 | $2,509 | $285,378 | $80,000 | $205,378 |
| 2024 | $2,499 | $285,378 | $80,000 | $205,378 |
| 2023 | $2,151 | $195,493 | $47,000 | $148,493 |
| 2022 | $1,999 | $195,493 | $47,000 | $148,493 |
| 2021 | $1,922 | $195,493 | $47,000 | $148,493 |
| 2020 | $1,887 | $195,493 | $47,000 | $148,493 |
| 2019 | $1,875 | $160,086 | $30,000 | $130,086 |
| 2018 | $1,769 | $160,086 | $30,000 | $130,086 |
| 2017 | $1,685 | $160,086 | $30,000 | $130,086 |
| 2016 | $1,651 | $160,086 | $30,000 | $130,086 |
| 2015 | $1,485 | $141,448 | $33,000 | $108,448 |
| 2014 | $1,409 | $141,448 | $33,000 | $108,448 |
Source: Public Records
Map
Nearby Homes
- 11309 Shadow Elms Ln
- 2220 Raven Rd Unit 104
- 2221 Valley Edge Dr Unit 105
- 2221 Valley Edge Dr Unit 100
- 2210 Raven Rd Unit 105
- 2210 Raven Rd Unit 106
- 2106 Cloud Cover
- 2220 Valley Edge Dr Unit 106
- 2220 Valley Edge Dr Unit 103
- 11006 Connally Ln
- 11130 Gwynn Oaks Dr Unit 106
- 2408 Gerber Ct
- 2111 Piney Brook Rd Unit 101
- 2101 Piney Brook Rd Unit 102
- 2110 Piney Brook Rd Unit 104
- 10859 Bedfordtown Dr
- 10638 Cardington Ln
- 10527 Bedfordtown Dr
- 10821 Farmville Rd
- 10507 Bedfordtown Dr
- 11411 Shadow Elms Ln
- 11417 Shadow Elms Ln
- 11409 Shadow Elms Ln
- 11407 Shadow Elms Ln
- 11419 Shadow Elms Ln
- 11421 Shadow Elms Ln
- 11405 Shadow Elms Ln Unit F
- 11423 Shadow Elms Ln
- 11403 Shadow Elms Ln
- 11414 Shadow Elms Ln
- 11416 Shadow Elms Ln
- 11418 Shadow Elms Ln
- 11427 Shadow Elms Ln
- 11420 Shadow Elms Ln
- 11410 Shadow Elms Ln
- 2205 Banks Hill Row Rd
- 2240 Banks Hill Row Rd
- 11422 Shadow Elms Ln
- 11408 Shadow Elms Ln
- 2240 Bankshill Row