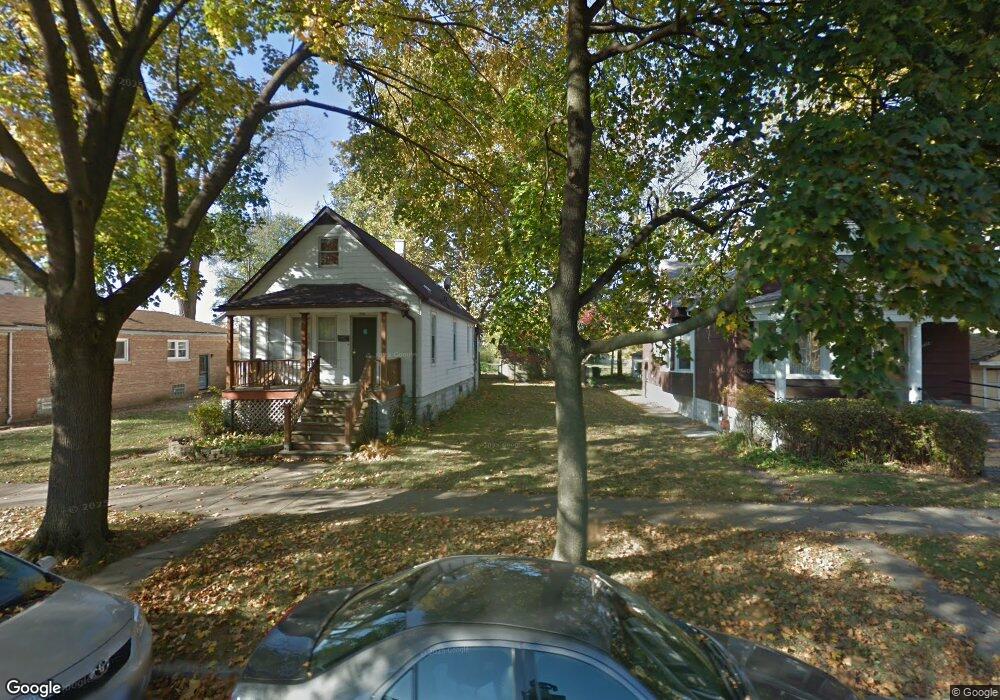
11416 S Princeton Ave Chicago, IL 60628
Roseland NeighborhoodEstimated Value: $276,000
--
Bed
--
Bath
--
Sq Ft
0.71
Acres
About This Home
This home is located at 11416 S Princeton Ave, Chicago, IL 60628 and is currently estimated at $276,000. 11416 S Princeton Ave is a home located in Cook County with nearby schools including Alex Haley Elementary Academy, Fenger Academy High School, and CICS Prairie.
Ownership History
Date
Name
Owned For
Owner Type
Purchase Details
Closed on
Aug 29, 2018
Sold by
Deutsche Bank National Trust Co
Bought by
Hawkins Walter L
Current Estimated Value
Purchase Details
Closed on
Mar 23, 2018
Sold by
Suggs Kattenia
Bought by
Deutsche Bank National Trust Company and Abs Capital I Trust
Purchase Details
Closed on
Oct 5, 2004
Sold by
Suggs Richardson Kattenia and Suggs Kattenia
Bought by
Suggs Kattenia
Home Financials for this Owner
Home Financials are based on the most recent Mortgage that was taken out on this home.
Original Mortgage
$75,200
Interest Rate
7.85%
Mortgage Type
Unknown
Purchase Details
Closed on
Jun 5, 2003
Sold by
Steczo Lillian
Bought by
Suggs Richardson Kattenia
Home Financials for this Owner
Home Financials are based on the most recent Mortgage that was taken out on this home.
Original Mortgage
$58,650
Interest Rate
9.75%
Mortgage Type
Unknown
Create a Home Valuation Report for This Property
The Home Valuation Report is an in-depth analysis detailing your home's value as well as a comparison with similar homes in the area
Home Values in the Area
Average Home Value in this Area
Purchase History
| Date | Buyer | Sale Price | Title Company |
|---|---|---|---|
| Hawkins Walter L | $18,000 | Attorney | |
| Deutsche Bank National Trust Company | -- | Attorney | |
| Suggs Kattenia | -- | Nations Title Agency | |
| Suggs Richardson Kattenia | $69,000 | -- |
Source: Public Records
Mortgage History
| Date | Status | Borrower | Loan Amount |
|---|---|---|---|
| Previous Owner | Suggs Kattenia | $75,200 | |
| Previous Owner | Suggs Richardson Kattenia | $58,650 |
Source: Public Records
Tax History Compared to Growth
Tax History
| Year | Tax Paid | Tax Assessment Tax Assessment Total Assessment is a certain percentage of the fair market value that is determined by local assessors to be the total taxable value of land and additions on the property. | Land | Improvement |
|---|---|---|---|---|
| 2024 | $291 | $2,030 | $1,845 | $185 |
| 2023 | $284 | $1,379 | $1,230 | $149 |
| 2022 | $284 | $1,379 | $1,230 | $149 |
| 2021 | $278 | $1,378 | $1,230 | $148 |
| 2020 | $411 | $1,839 | $1,691 | $148 |
| 2019 | $370 | $1,839 | $1,691 | $148 |
| 2018 | $364 | $1,839 | $1,691 | $148 |
| 2017 | $364 | $1,685 | $1,537 | $148 |
| 2016 | $338 | $1,685 | $1,537 | $148 |
| 2015 | $310 | $1,685 | $1,537 | $148 |
| 2014 | $285 | $1,531 | $1,383 | $148 |
| 2013 | $279 | $1,531 | $1,383 | $148 |
Source: Public Records
Map
Nearby Homes
- 11353 S Stewart Ave
- 11516 S Yale Ave
- 11521 S Yale Ave
- 11532 S Harvard Ave
- 11531 S Stewart Ave
- 125 W 114th St
- 128 W 115th St
- 352 W 116th St
- 11317 S Eggleston Ave
- 120 W 115th St
- 11413 S Normal Ave
- 406 W 116th St Unit 412
- 11326 S Eggleston Ave
- 412 W 116th St
- 11612 S Yale Ave
- 106 W 114th St
- 500 W 115th St
- 411 W 116th St
- 11559 S Wentworth Ave
- 11527 S La Salle St
- 11418 S Princeton Ave
- 11412 S Princeton Ave
- 11420 S Princeton Ave
- 11422 S Princeton Ave
- 11426 S Princeton Ave
- 307 W 114th St
- 303 W 114th St
- 311 W 114th St
- 11428 S Princeton Ave
- 11428 S Princeton Ave Unit 2
- 11428 S Princeton Ave Unit 2
- 11428 S Princeton Ave Unit 2ND
- 11428 S Princeton Ave Unit 1ST
- 11415 S Harvard Ave
- 11415 S Harvard Ave
- 11419 S Harvard Ave
- 11423 S Harvard Ave
- 11432 S Princeton Ave
- 11427 S Harvard Ave
- 257 W 114th St