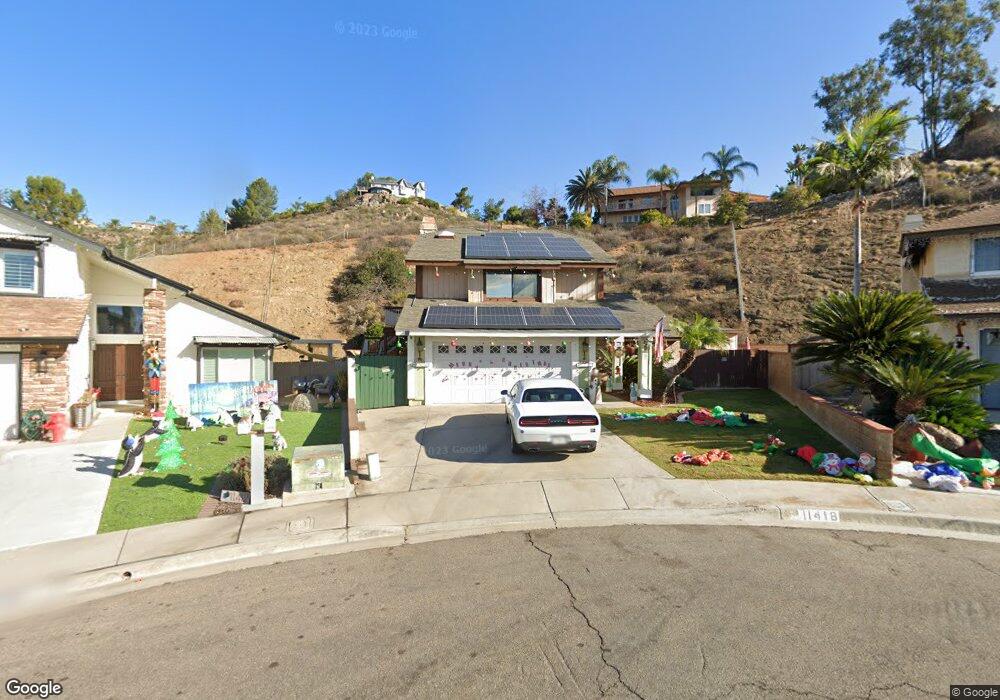
11418 Ming Ct El Cajon, CA 92021
Bostonia NeighborhoodEstimated Value: $876,000 - $931,000
4
Beds
3
Baths
1,818
Sq Ft
$493/Sq Ft
Est. Value
About This Home
This home is located at 11418 Ming Ct, El Cajon, CA 92021 and is currently estimated at $897,097, approximately $493 per square foot. 11418 Ming Ct is a home located in San Diego County with nearby schools including Pepper Drive Elementary School, Santana High School, and St. Kieran Catholic School.
Ownership History
Date
Name
Owned For
Owner Type
Purchase Details
Closed on
Jul 26, 2001
Sold by
Mcaloney Christy and Mcaloney Frank E
Bought by
Mcaloney Scot and Mcaloney Christy
Current Estimated Value
Home Financials for this Owner
Home Financials are based on the most recent Mortgage that was taken out on this home.
Original Mortgage
$270,000
Outstanding Balance
$105,779
Interest Rate
7.21%
Estimated Equity
$791,318
Purchase Details
Closed on
Mar 21, 1996
Sold by
Mcaloney Scot
Bought by
Mcaloney Christy and Mcaloney Frank E
Home Financials for this Owner
Home Financials are based on the most recent Mortgage that was taken out on this home.
Original Mortgage
$193,800
Interest Rate
8.03%
Purchase Details
Closed on
Jul 31, 1984
Create a Home Valuation Report for This Property
The Home Valuation Report is an in-depth analysis detailing your home's value as well as a comparison with similar homes in the area
Home Values in the Area
Average Home Value in this Area
Purchase History
| Date | Buyer | Sale Price | Title Company |
|---|---|---|---|
| Mcaloney Scot | -- | Lawyers Title | |
| Mcaloney Christy | -- | Old Republic Title Company | |
| Mcaloney Christy | $204,000 | Old Republic Title Company | |
| -- | $113,400 | -- |
Source: Public Records
Mortgage History
| Date | Status | Borrower | Loan Amount |
|---|---|---|---|
| Open | Mcaloney Scot | $270,000 | |
| Previous Owner | Mcaloney Christy | $193,800 |
Source: Public Records
Tax History Compared to Growth
Tax History
| Year | Tax Paid | Tax Assessment Tax Assessment Total Assessment is a certain percentage of the fair market value that is determined by local assessors to be the total taxable value of land and additions on the property. | Land | Improvement |
|---|---|---|---|---|
| 2025 | $4,103 | $352,016 | $136,545 | $215,471 |
| 2024 | $4,103 | $345,115 | $133,868 | $211,247 |
| 2023 | $3,974 | $338,349 | $131,244 | $207,105 |
| 2022 | $3,943 | $331,716 | $128,671 | $203,045 |
| 2021 | $3,893 | $325,213 | $126,149 | $199,064 |
| 2020 | $3,846 | $321,879 | $124,856 | $197,023 |
| 2019 | $3,713 | $315,568 | $122,408 | $193,160 |
| 2018 | $3,651 | $309,381 | $120,008 | $189,373 |
| 2017 | $861 | $303,315 | $117,655 | $185,660 |
| 2016 | $3,475 | $297,369 | $115,349 | $182,020 |
| 2015 | $3,420 | $292,903 | $113,617 | $179,286 |
| 2014 | $3,349 | $287,167 | $111,392 | $175,775 |
Source: Public Records
Map
Nearby Homes
- 6301 Triana St
- 5120 Sevilla St
- 1407 Cascade Place
- 1120 Pepper Dr Unit 2
- 1120 Pepper Dr Unit 17
- 1120 Pepper Dr Unit SPC 86
- 1120 Pepper Dr Unit 73
- 1120 Pepper Dr Unit 79
- 1120 Pepper Dr Unit 84
- 1120 Pepper Dr Unit 11
- 450 E Bradley Ave Unit 115
- 450 E Bradley Ave Unit 127
- 450 E Bradley Ave Unit 36
- 450 E Bradley Ave Unit 144
- 450 E Bradley Ave Unit 157
- 450 E Bradley Ave Unit 80
- 450 E Bradley Ave Unit 106
- 450 E Bradley Ave Unit 18
- 450 E Bradley Ave Unit 116
- 1673 Stone Edge Cir
- 11412 Ming Ct
- 11424 Ming Ct
- 8327 Solomon Ave
- 11427 Ming Ct
- 8343 Solomon Ave
- 11415 Ming Ct
- 11421 Ming Ct
- 8349 Solomon Ave
- 8321 Solomon Ave
- 8355 Solomon Ave
- 8317 Solomon Ave
- 8348 Oconnell Rd
- 8311 Solomon Ave
- 8361 Solomon Ave
- 11420 Pegeen Place
- 11426 Pegeen Place
- 11432 Pegeen Place
- 11414 Pegeen Place
- 8308 Oconnell Rd
- 8336 Solomon Ave