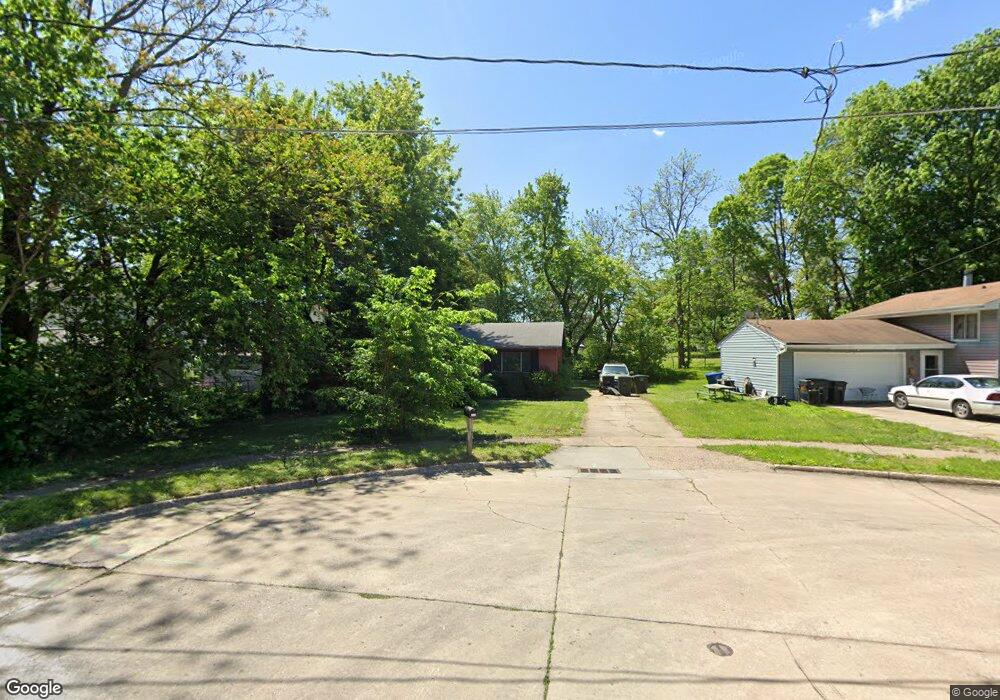
1142 Ascension St Des Moines, IA 50314
Cheatom Park NeighborhoodEstimated Value: $119,000 - $127,423
3
Beds
1
Bath
864
Sq Ft
$144/Sq Ft
Est. Value
About This Home
This home is located at 1142 Ascension St, Des Moines, IA 50314 and is currently estimated at $124,106, approximately $143 per square foot. 1142 Ascension St is a home located in Polk County with nearby schools including Moulton Elementary School, Harding Middle School, and North High School.
Ownership History
Date
Name
Owned For
Owner Type
Purchase Details
Closed on
Jul 15, 2024
Sold by
Lane Investments Llc
Bought by
Bellani Properties Llc
Current Estimated Value
Purchase Details
Closed on
Dec 6, 1993
Sold by
Conner Charles J
Bought by
Conner Charles J and Cooley Carla J
Create a Home Valuation Report for This Property
The Home Valuation Report is an in-depth analysis detailing your home's value as well as a comparison with similar homes in the area
Home Values in the Area
Average Home Value in this Area
Purchase History
| Date | Buyer | Sale Price | Title Company |
|---|---|---|---|
| Bellani Properties Llc | $70,000 | None Listed On Document | |
| Lane Investments Llc | -- | None Listed On Document | |
| Conner Charles J | -- | -- |
Source: Public Records
Tax History Compared to Growth
Tax History
| Year | Tax Paid | Tax Assessment Tax Assessment Total Assessment is a certain percentage of the fair market value that is determined by local assessors to be the total taxable value of land and additions on the property. | Land | Improvement |
|---|---|---|---|---|
| 2025 | $1,046 | $128,800 | $14,600 | $114,200 |
| 2024 | $1,046 | $79,300 | $12,400 | $66,900 |
| 2023 | $1,146 | $79,300 | $12,400 | $66,900 |
| 2022 | $1,134 | $60,900 | $9,500 | $51,400 |
| 2021 | $1,062 | $60,900 | $9,500 | $51,400 |
| 2020 | $1,094 | $54,400 | $8,400 | $46,000 |
| 2019 | $1,020 | $54,400 | $8,400 | $46,000 |
| 2018 | $1,002 | $49,700 | $7,500 | $42,200 |
| 2017 | $1,050 | $49,700 | $7,500 | $42,200 |
| 2016 | $1,016 | $50,600 | $7,500 | $43,100 |
| 2015 | $1,016 | $50,600 | $7,500 | $43,100 |
| 2014 | $866 | $44,600 | $7,200 | $37,400 |
Source: Public Records
Map
Nearby Homes